
Full-screen workspace
Press F to give the analyser the whole window: the traces on the left, and on the right a card per zone over a well that reads whatever you focus, or the whole blast.
Press F, or click Full screen at the top right of the charts, and the analyser takes the whole window. The page header steps aside and nothing scrolls: the traces sit on the left, and the review sits on the right, a card per zone over a well that reads whatever you focus. Full screen is the zone review. There is no separate dialog.
The layout
- Peek tabs along the top. Readings has the first figures for whatever is focused or framed. Settings has the sample rate, the record length and the cable calibration, and its heading opens the event's details. Holes & zones gives how many there are.
- Traces on the left: the overview, or the timeline tracks, above the detail chart.
- Review on the right: the zone rail above the focus well.
Drag the dividers to resize the columns and the rail. The split is remembered in your browser.
The zone rail
The rail has a card per zone, grouped under a numbered badge per hole in firing order. Zones not linked to a hole sit at the end under Unassigned. Each card has the zone's name, its confidence dot, a small trace, the view's figure, and its difference from the hole's average, coloured when it is more than 10 %.
| Review view | The card's figure | Under it |
|---|---|---|
| Cable Length | The zone's VoD | Cable and duration |
| Continuous VoD | The mean continuous VoD | Its lowest and highest |
| Segmented VoD | The final cumulative VoD | The run-up and the spread |
Click a card, or a hole's badge, to focus it. With the rail selected, ← and → move between cards and Enter opens the details.
The review view
The rail and the well share one view, whatever the detail chart shows. Press < and > to cycle it through Cable Length, Continuous VoD and Segmented VoD, or click either title.
The focus well
The well draws what you focus, on its own and at a size where a fit can be judged. The detail chart keeps the whole hole in view beside it.
- A zone is framed to its own samples, under a title naming the zone, its hole and the view.
- A hole is framed across its zones, each labelled with its VoD.
- On Continuous VoD the well adds the Mean and, when the hole has one, the Plan.
- On Cable Length, drag across the trace in the well to read that Section: its VoD, its length and duration, and its difference from the zone or hole it came from. The × on the chip clears it.
The crosshair frames the well's subject on the detail chart, and Details (Enter) opens the hole's details.
The blast overview
With nothing focused, the well shows the whole recording as Blast · Zone VoD. Each hole is a lane in firing order, with a dot for each zone's VoD, a short bar at the hole's average and a dashed line at its plan. A dashed line across the whole plot marks the blast's mean. A zone more than 10 % from its hole, the blast or the plan gets a ring. Click a dot to focus that zone, or a hole's badge to focus the hole.
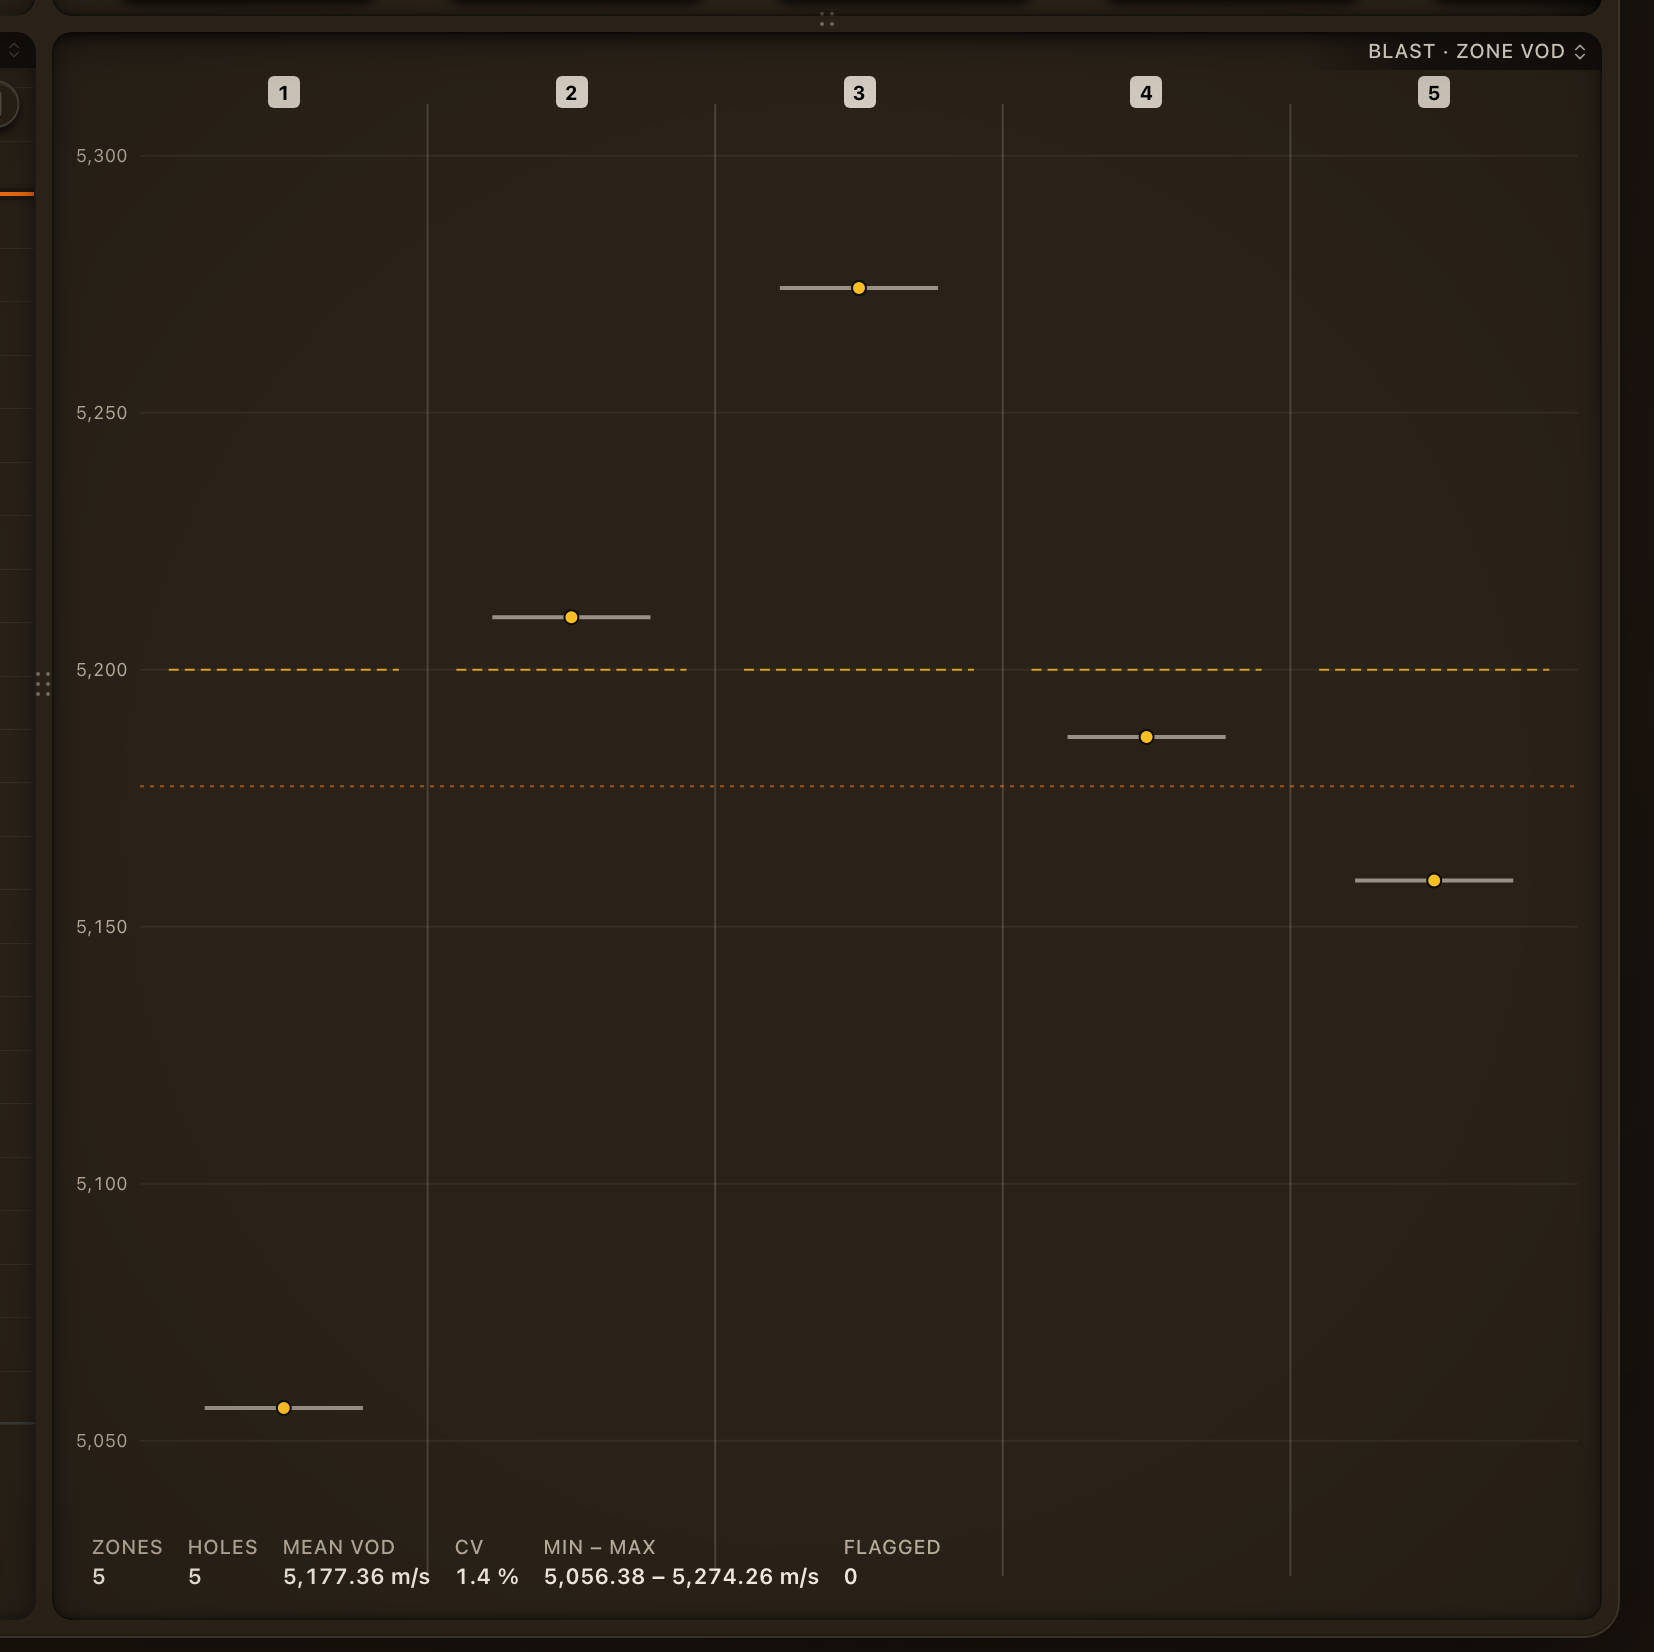
With column ranges showing, the overview reads the ranges instead. See Comparing ranges.
Leaving
Press F again, or click Exit full screen. Esc leaves too, once nothing else is holding it: each press first closes a dialog, then stops placing a hole, then leaves the ruler, ends an edit, and lets go of the focus.
Details worth knowing
- Full screen is part of the page's address (
?expand=1), so a refresh or a shared link comes back the same way, and moving to the previous or next event keeps it. - The workspace needs a browser window of at least 1072 × 760 pixels. Below that, full screen stretches the detail chart instead.
- Every keyboard shortcut works in full screen, and a plain scroll zooms the chart. Press ? for the sheet, or Ctrl+K for the command palette.