
Metrics and deviations
What each VoD figure is and how it is worked out, why a hole's VoD is the mean of its zones, when a zone is flagged, how confidence is judged, and what cable calibration does.
Every figure in the analyser comes from one model, so What is in view, the readout card, the full-screen well and the zone CSV always agree. Which figures you see depends on two things: the view you are on (cable length, continuous or segmented) and the subject you are reading (a zone, a hole, a window you framed, a column range, or the whole blast).
The figures
| Subject | Cable Length | Continuous VoD | Segmented VoD |
|---|---|---|---|
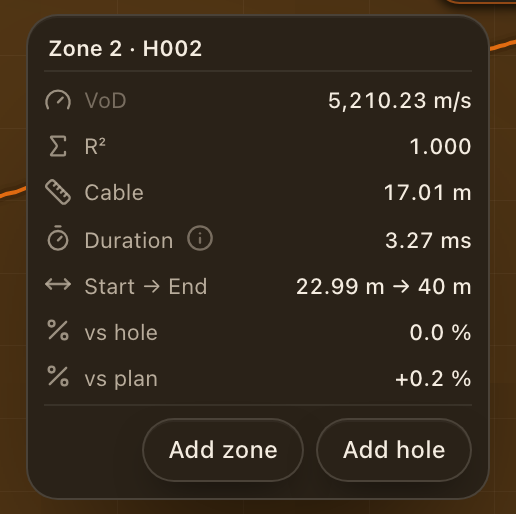
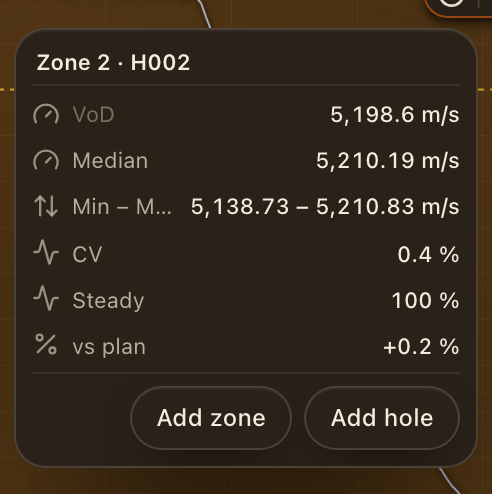
| Zone | VoD, R², Cable, Duration, Start → End, vs hole, vs plan | Mean, Median, Min – Max, CV, Steady, vs plan | Final VoD, Run-up, Spread, Intervals |
| Hole | Average VoD, Cable used, Duration, Zones, Min – Max, CV | Mean, Min – Max, CV | Zones, Final range, Max spread |
| A window you framed | VoD, R², Length, Duration | Mean, Min – Max, Duration | As Cable Length |
| The whole blast (the full-screen well, nothing focused) | Zones, Holes, Mean VoD, CV, Min – Max, Flagged | Zones, Mean, CV | As Cable Length |
A held column range reads as a zone does, with the stretch it covered (Window) and its difference from the same range across the holes. See Comparing ranges. In What is in view, the continuous Mean is labelled VoD. Over the whole record, a window's VoD and R² read N/A: one line through a whole shot means nothing.
How they are worked out
- Zone VoD is the slope of a straight line fitted through the trace across the zone by least squares, with time in seconds and cable in metres, to 0.01 m/s. It is the velocity you report for a deck. R² says how straight the samples were: a clean detonation reads 0.999 or better.
- Average VoD for a hole is the mean of its zones' VoDs, each deck weighted equally. It is never one line fitted across the gaps between decks, which the stemming would drag down. A hole's Cable used and Duration run from its first zone's start to its last zone's end, gaps included.
- Mean VoD for the blast is the mean of every zone's VoD, and it is the baseline vs blast is measured from.
- Continuous figures are read over the continuous VoD samples in the subject. CV is their spread as a share of their mean. Steady is the share of samples within 10 % of the median.
- Segmented figures split the zone into ten equal intervals and read its VoD cumulatively from the zone's start: Final VoD is the last point, Run-up the first tenth, and Spread the range of the ten as a share of the final value.
Deviations
A zone is compared three ways, each as a percentage of the figure it is compared with:
- vs hole: against the average of its hole's zones.
- vs blast: against the mean of every zone on the recording.
- vs plan: against its hole's planned VoD, when the hole has one.
vs hole and vs plan appear among a zone's figures on Cable Length, and vs plan on Continuous VoD too, where it is still the zone's fitted VoD against the plan, not the continuous mean beside it. All three go into the zone CSV.
A zone is flagged when any of the three is more than 10 % away. A flagged zone gets a ring in the full-screen blast overview and a coloured Δ hole in the readout, and the flagged zones are counted in Flagged. The zone cards in the full-screen rail colour their own figure on vs hole alone.
A deviation is a question to ask, not an answer. A slow zone may be a real change in the column, or a zone drawn across a gap.
Confidence
Beside a zone's VoD, a dot says how far to trust the fit:
- green when it was measured over 100 cm of cable or more;
- amber between 30 and 100 cm;
- red over 30 cm or less;
- and one step down from any of those when R² is below 0.98.
Quote an amber or red zone's velocity with that caveat. The Analysis tab of a hole's details grades its zones against the unit's own specification instead.
Planned VoD
A hole's planned VoD is the velocity its product is rated for. It comes from the blast plan (see Importing a blast plan), or from the hole's own Planned VoD field. It is what vs plan is measured from and what the readout's Planned row shows. On Continuous VoD it is drawn as a dashed Plan line across the hole's zones.
Cable calibration
The unit does not measure metres directly. Cable calibration is the factor that turns what it senses into cable length, set on the unit for the cable in use and recorded with each event. Read it in the Settings tab at the top of the page, beside the sample rate and the record length, or in the event's details under Event, then Measurement.
A wrong calibration scales every VoD on the event by the same ratio. If the figures are all high or all low by a similar amount, check the calibration before anything else.
Metric definitions
| Metric | What it is | Formula | Scope | Note |
|---|---|---|---|---|
| Average VoD | Summary VoD for the whole hole. | One deck → that deck's VoD. Multiple decks → average of each deck's VoD. | All explosive decks in this hole. | Zone cards in the review column show each deck's VoD separately. |
| Avg VoD (zone mean) | Summary VoD for the hole based on its measured decks. | Average of each explosive deck's VoD. | Explosive decks only — stemming excluded; each deck weighted equally. | Matches Average VoD in the focus readout for the same hole. |
| Zone VoD | Pipeline VoD for one explosive deck. | OLS linear regression slope of consumed cable vs time across the zone span. | Single explosive zone only — not a hole-wide or selection-wide average. | |
| Gap / cut timing | Dead time between initiation events on the chart timeline. | Elapsed time from the end of the preceding explosive zone to the start of the next. | May include stemming traversal; shown between holes or between decks. | |
| Length | Cable distance covered in the current chart selection or zone context. | End cable position minus start cable position for the selected sample range. | Matches the highlighted chart range or anchored zone bounds. | |
| Duration | Elapsed recording time for the current chart selection or zone context. | End sample time minus start sample time for the selected range. | Includes any stall or gap samples inside the selected span. |