
Comparing ranges
Read the same stretch of every hole side by side: the toe, the toe and the middle, thirds, or a set your project saves. Each range is read from the cable trace, and no zone is drawn.
A column range is the same stretch of every hole, measured up from the toe: the bottom tenth, say, of each hole on the recording. Press Shift+R to show one. The analyser reads that stretch of each hole from the cable trace and sets the readings side by side.
Show a set of ranges
Click Ranges on the toolbar and choose a set, or press Shift+R to step through them: Toe, Toe + middle, Thirds, then your project's saved sets, then Off.
| Set | Ranges |
|---|---|
| Toe | The bottom 10 % of the column |
| Toe + middle | The bottom 10 %, and 45–55 % |
| Thirds | Bottom third, Middle third and Top third |
Each range draws on the chart as a tinted band carrying its name, on Cable Length and Continuous VoD alike. Focus a hole and its readout gains a row per range, with the range's VoD and how far it sits from that range's mean. Click a row to select that stretch of the trace and hold the range.
Compare the holes
Click Compare table… in the Ranges menu. The Column ranges table has a row per hole, in firing order, and a column per range. Each cell gives the range's VoD, a confidence dot, and how far the reading sits from that range's mean across the holes. Hover a cell for the cable it was read over, how long it took, its R², and how far it sits from the hole's own VoD and from the plan.
Under the holes, each range gets its Mean, its CV (the spread as a share of the mean), Min – max, and the number of Holes it was read on. A reading more than 10 % from its range's mean, from its hole's VoD or from the plan is flagged.
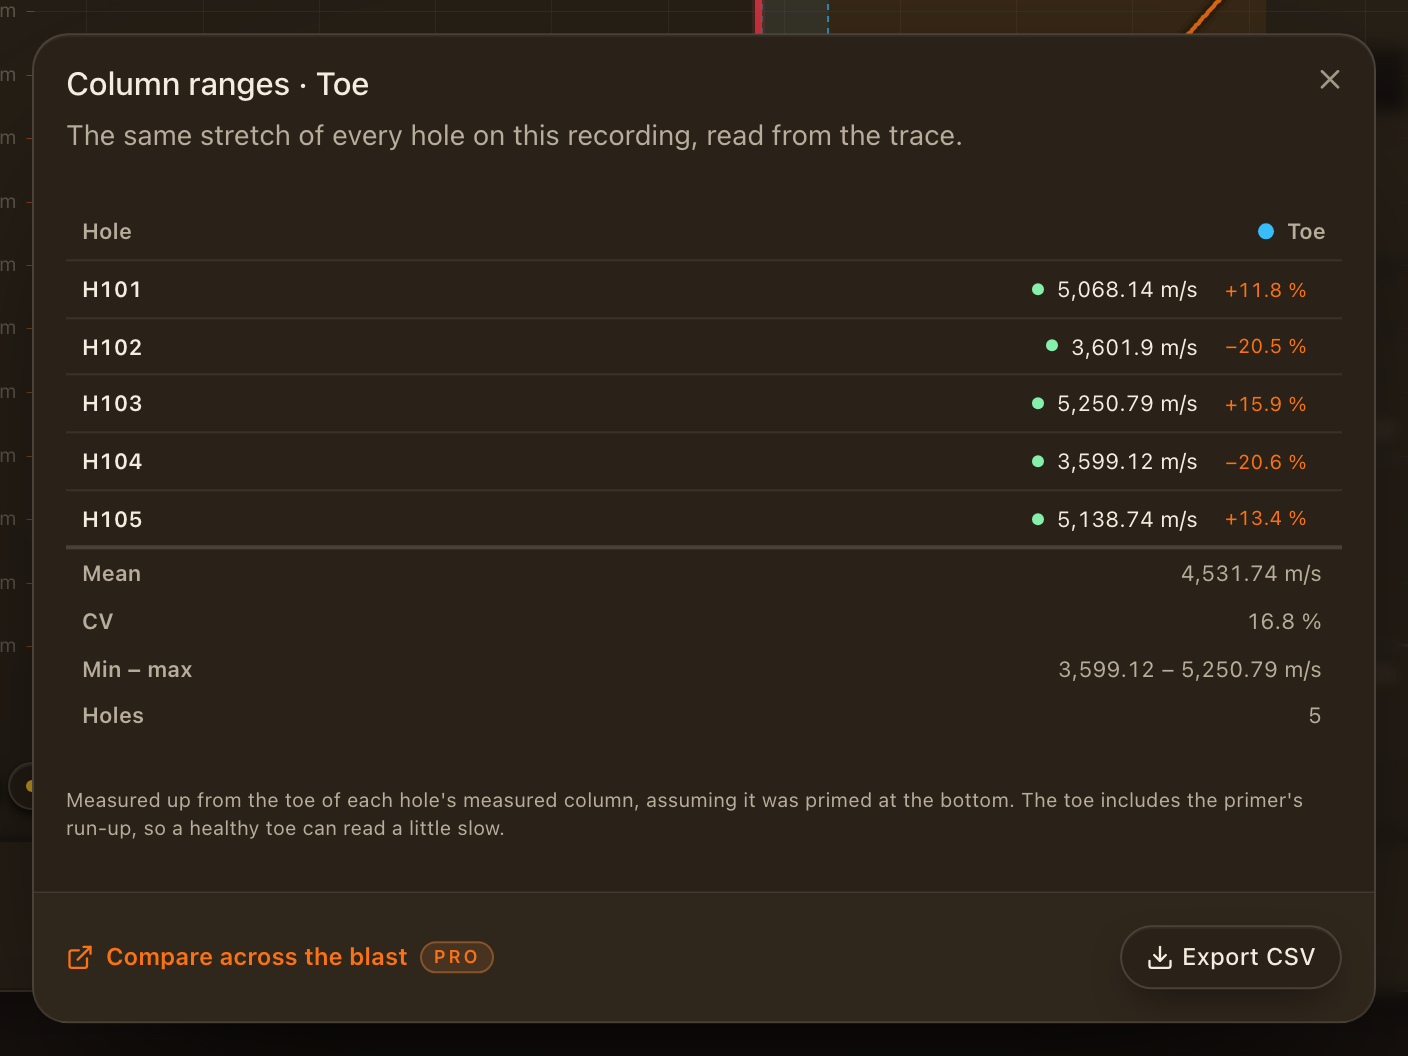
Click a reading to focus its hole with that range held. The chart frames the hole, and in the full-screen workspace the well reads the range.
Hold a range while you step
With a range held, the digit keys still walk the holes: press 1 to 9 and each hole opens on the same range. In the full-screen workspace the well frames the range on its hole under a title such as Toe · H102 · Cable Length. The chips at the top of the well move between each range and Whole hole, which lets go of the range. Until then the range stays held, even when you let go of the hole, so the next hole you focus opens on it too.
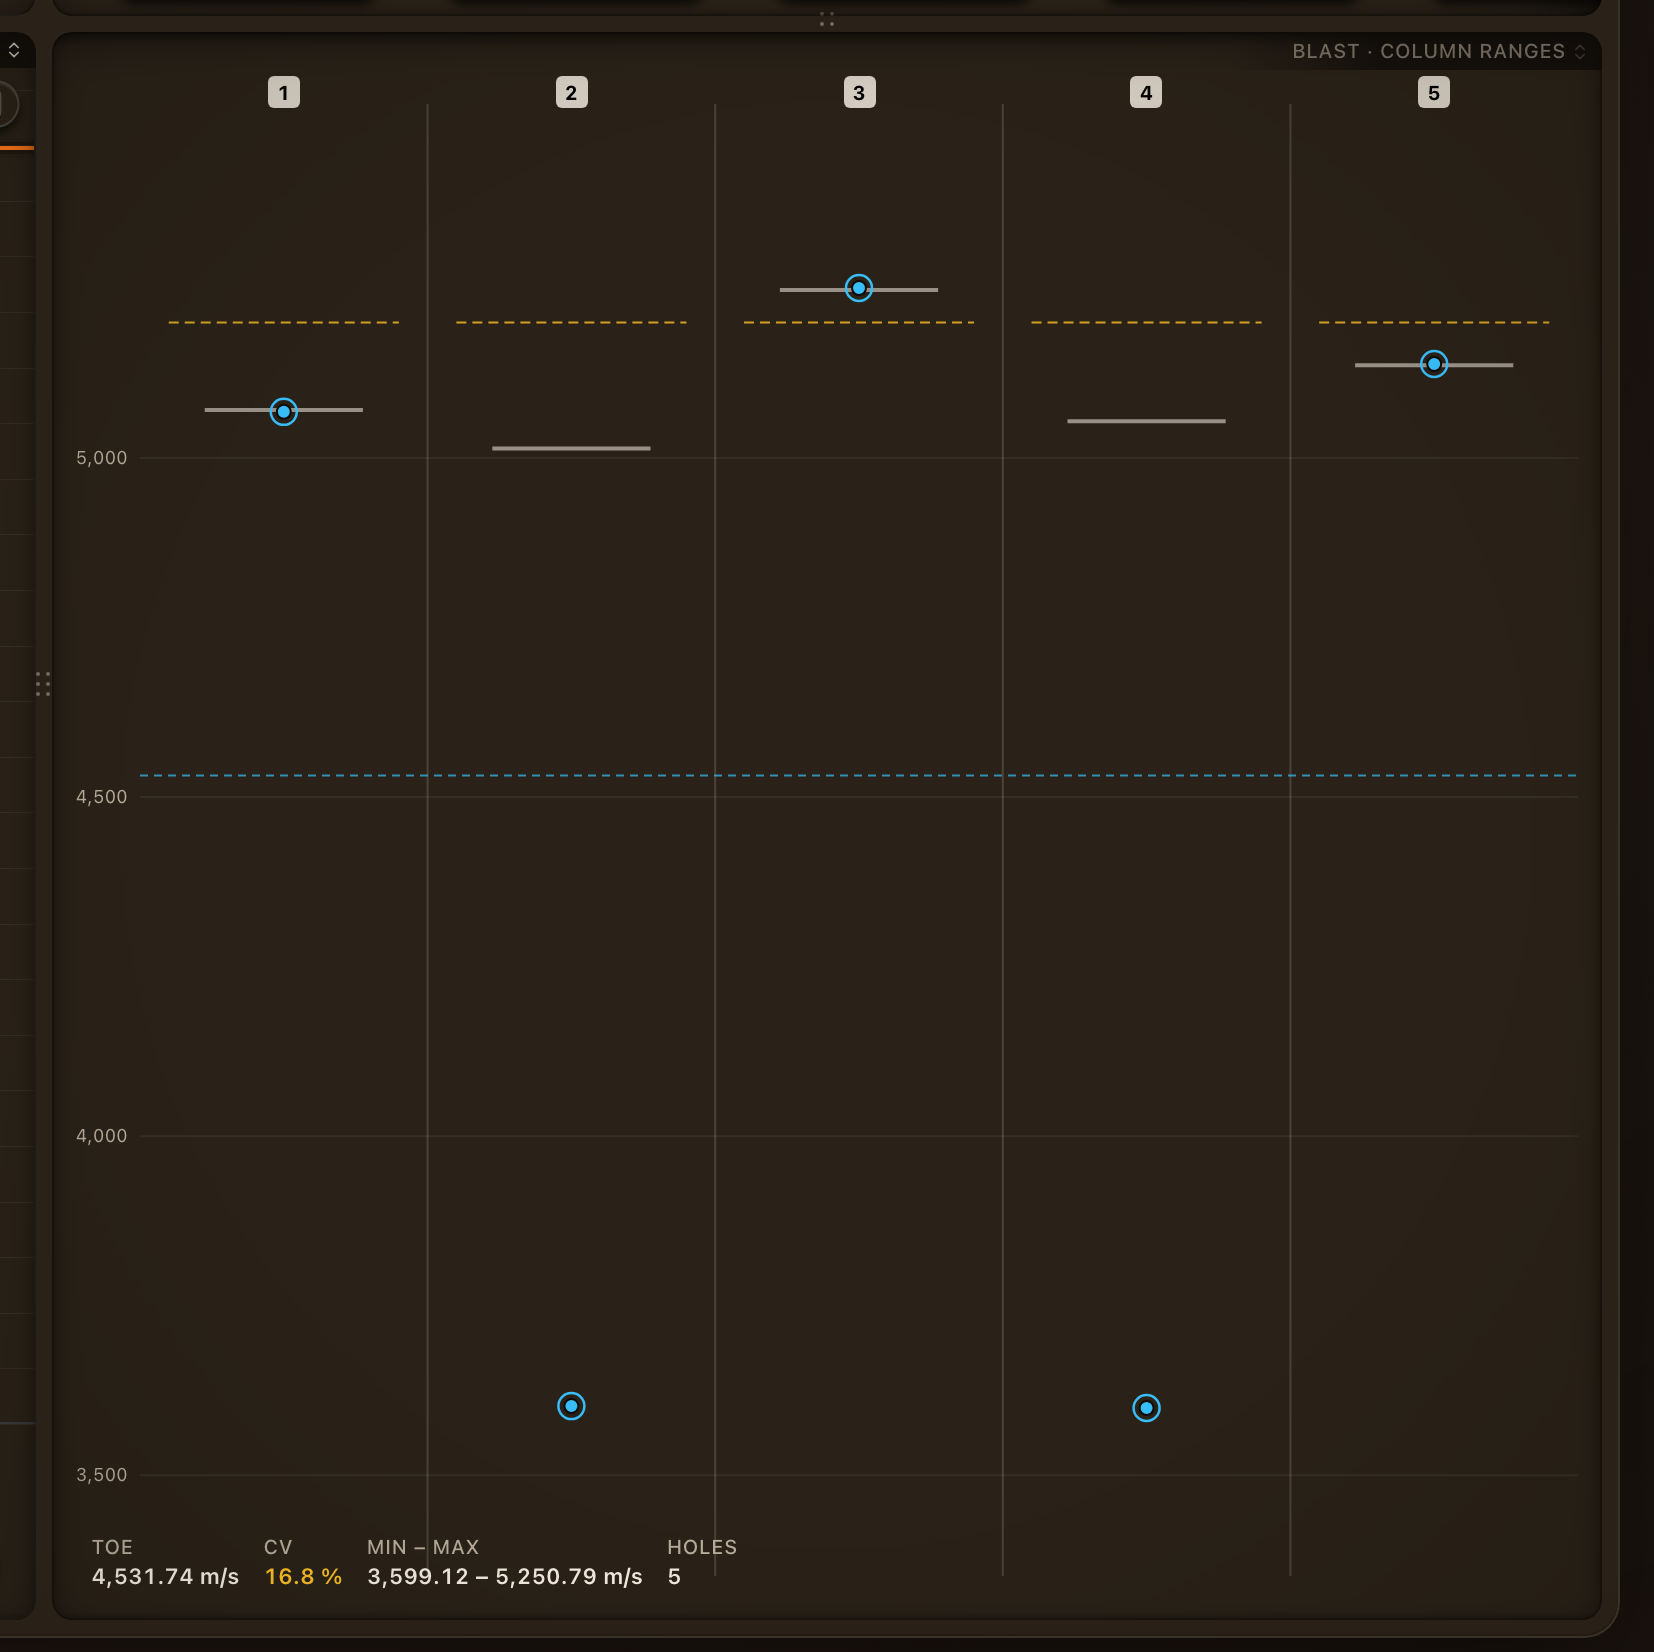
With nothing focused, the well's blast overview switches to the ranges: a dot per hole and range, and a dashed line at each range's mean. Its figures give each range's mean across the holes. With one range showing, they also give its CV, its Min – Max and the number of Holes it was read on.
Your own ranges
Choose Custom… in the Ranges menu to set up to four ranges of your own. Give each a From and a To, as % of column or in metres up from the toe, and an optional Label, then click Show.
To keep a set for everyone on the project, click Save to project… and name it. Saved sets appear under Saved for this project, and Shift+R steps through them after the presets. Anyone who can edit the project can save, rename and delete sets. Everyone who can open it can use them.
A link carries the set it was shared with, so a colleague opening it sees the same ranges.
How a range is read
- Up from the toe of the measured column. A hole's measured column runs from where its first zone starts to where its last zone ends. Holes are assumed to be primed at the bottom, so the toe includes the primer's run-up and a healthy toe can read a little slow.
- From the trace. Where a range starts and ends is found from the cable the trace consumed, never from a length typed into the hole.
- Across gaps. A range that crosses the stemming between two decks is read in pieces, one fit per piece, and its VoD is the pieces' mean weighted by their length. It is never one line fitted across the gap. The tooltip says when a reading was made that way.
- Metres past the column. A range set in metres that runs above the top of the column is cut short there, and the cell says so.
- When a reading cannot be made, the cell says why: No zones, No trace, Beyond the column, Between zones or Too short to read.
Ranges are worked out as you look at them and never saved as zones. The hole and blast figures, the deviations, the zone export and the report stay exactly as they were.
Export
Click Export CSV under the table, or choose Export column ranges (CSV) from the event actions menu. You get one row per hole and range, in SI units.
Across the whole blast
A recording is one cable through a few holes. To compare every hole of the blast, click Compare across the blast under the table. The ShockAI Visualiser opens on the blast with the same ranges showing, every recorder's holes in one table, and a sleeve on each hole coloured by what its range read.