
VoD Analyser
Read a velocity-of-detonation recording: the cable trace and its continuous and segmented VoD, holes and zones, blast timing and the plan, column ranges, and the figures to quote.
The VoD Analyser opens one VoD event. The event records how much probe cable the detonation consumed over time, as the front travelled through each hole on the cable. From that one trace the analyser gives you a velocity of detonation for every charged deck, for every hole and for the recording as a whole, and shows how each compares with the plan.
Watch a first pass
The walkthrough is chaptered. Each page in this section opens with its own chapter, so you can watch the part you need and read the rest.
What is on the page
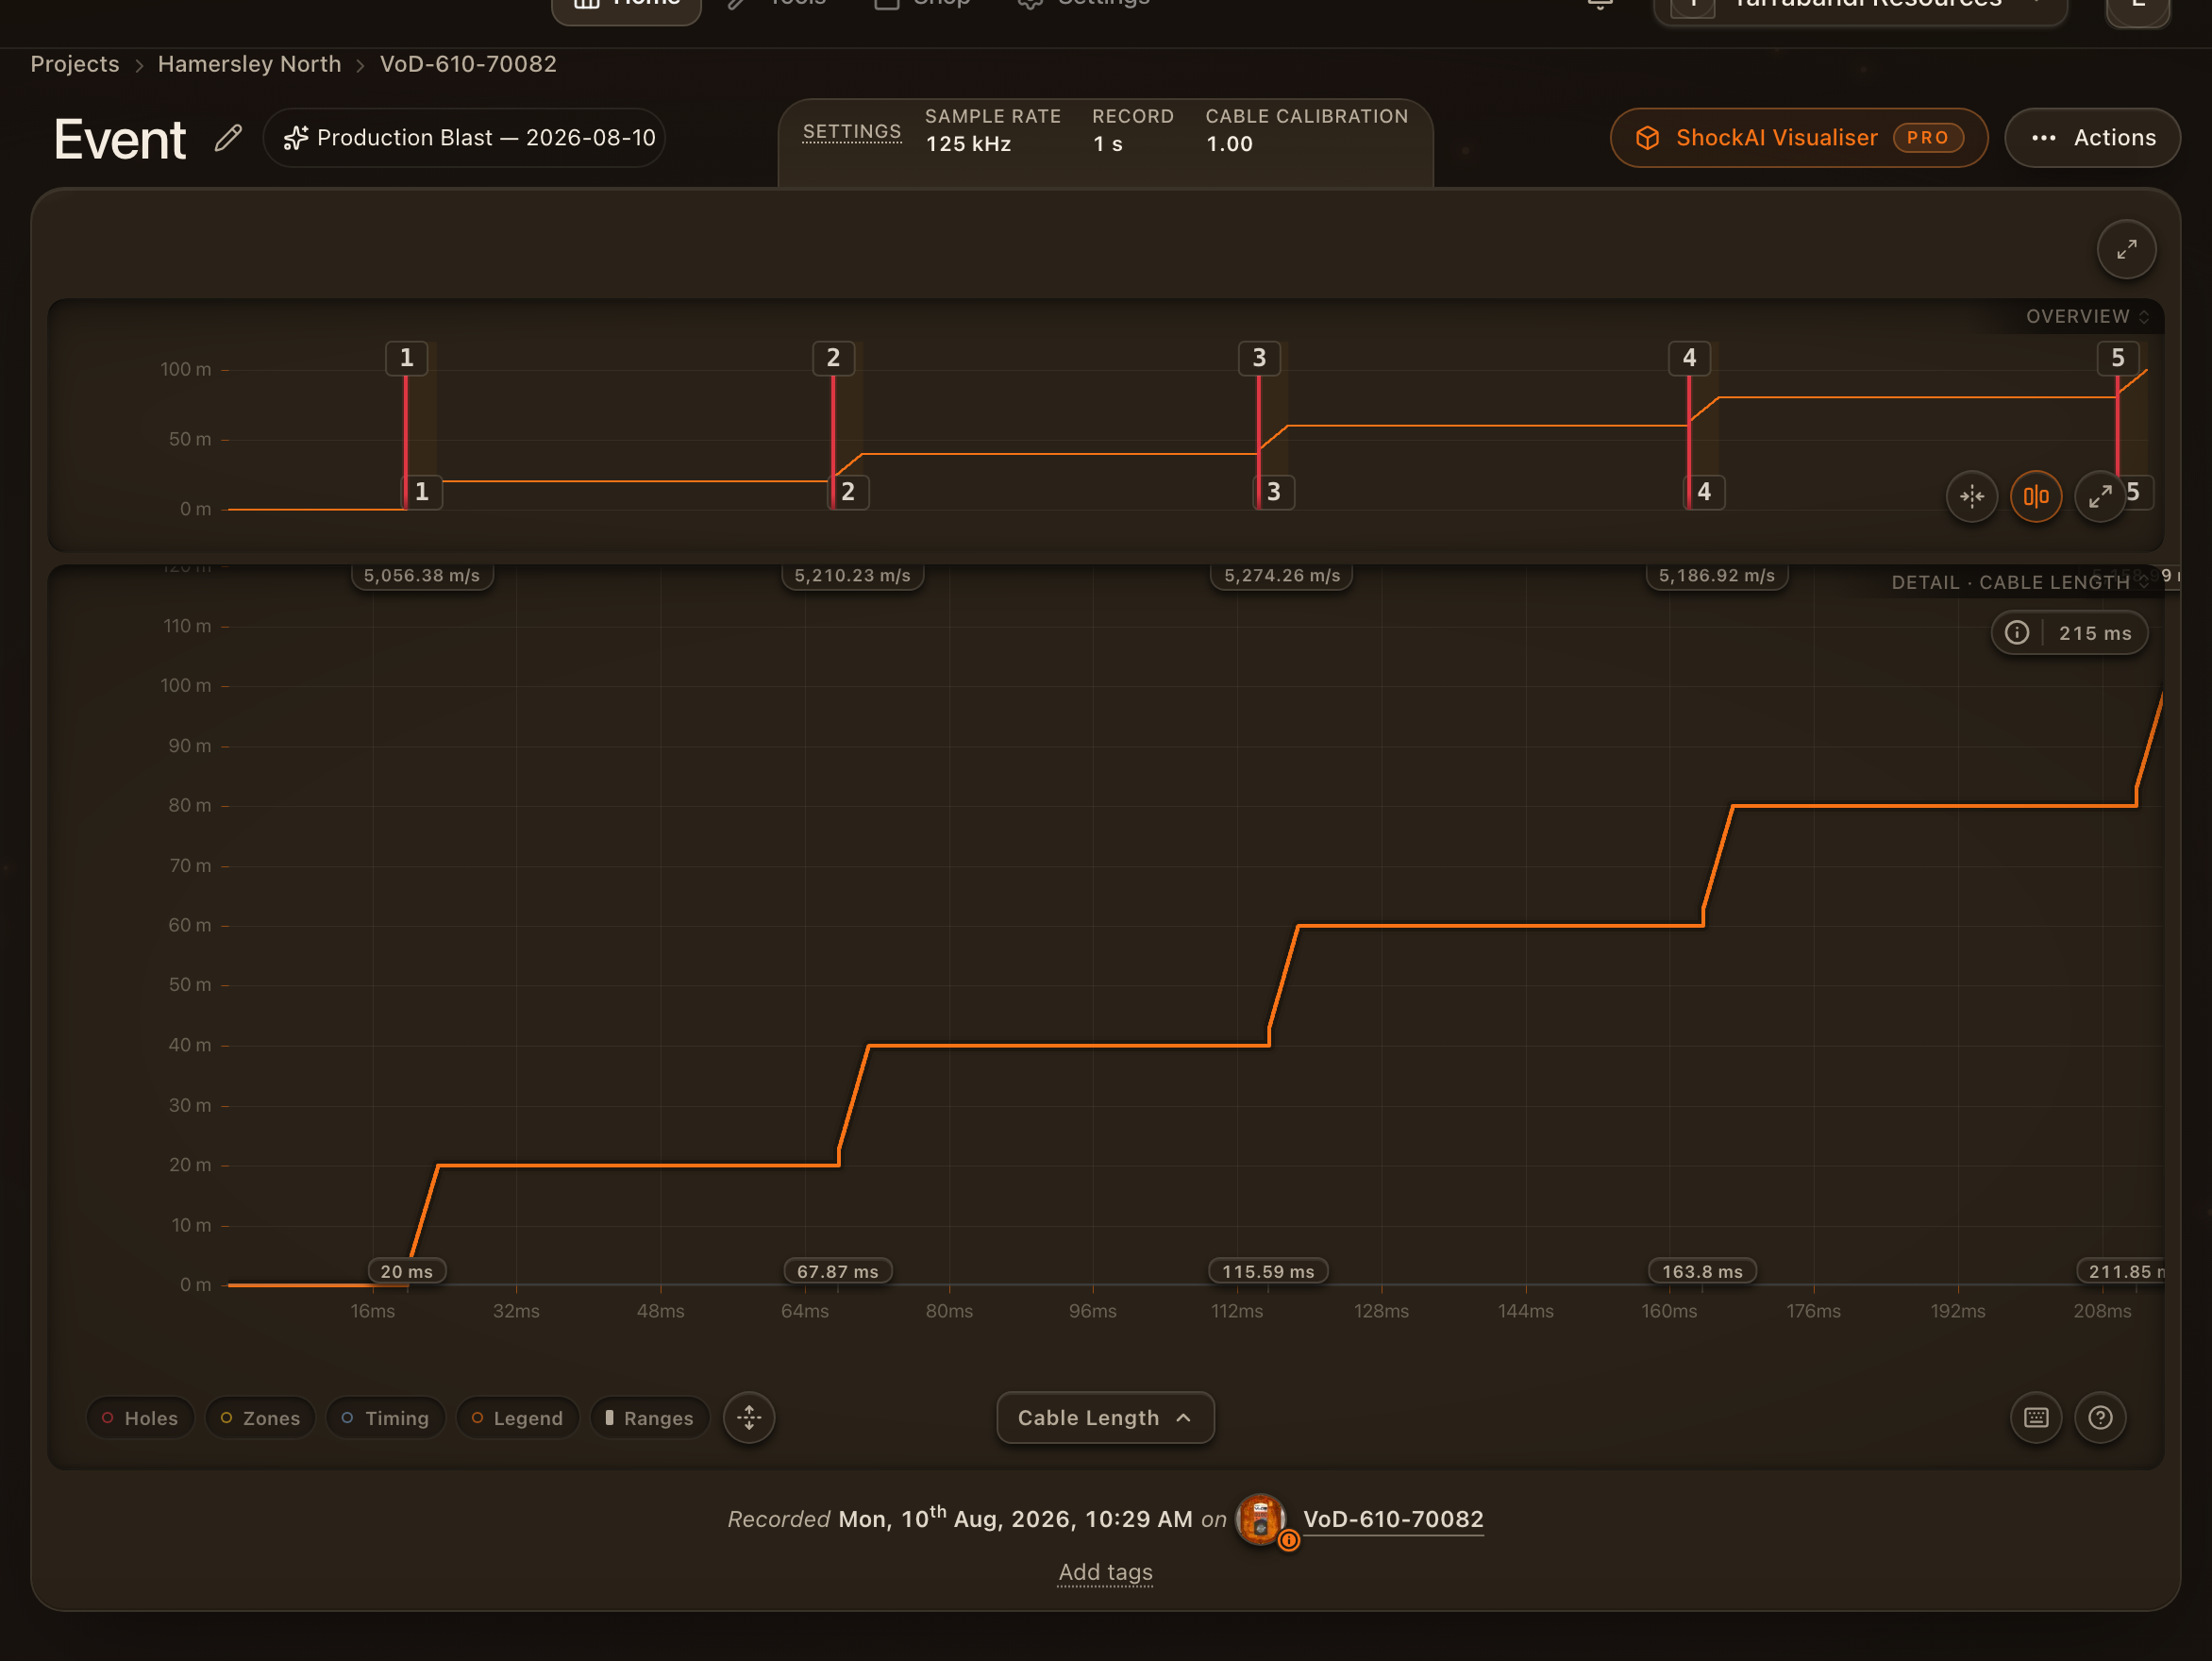
- Header.
- On the left, the event's name, with a pencil to rename it, and the blast chip naming the blast it is on. A blast that was only suggested offers Confirm.
- In the middle, the Settings tab gives the sample rate, the record length and the cable calibration.
- On the right, the orange ShockAI Visualiser button puts the blast in three dimensions, and the Actions menu holds reports and exports.
- Overview. At the top, it spans the whole record. Drag across it to frame the window the detail chart shows. Press Shift+O to swap it for the Timeline: tracks for holes, timing and zones.
- Detail chart. It reads your window in one of three views: Cable Length, Continuous VoD or Segmented VoD. The chip at its top right gives the zoom, and its (i) opens What is in view. The toolbar along its bottom holds the overlay pills, the chart type, the keyboard shortcuts and Help.
- Context line. Under the chart, it says when and where the event was recorded, and on which unit.
- Readout card. When you focus a hole or zone, it sets the planned figures beside what was recorded.
Open the analyser from any VoD event in a project or session. The first time you do, a short tour points out the main parts. You can replay it, and every other tour, from Help.
The moves that matter
- Drag across the Overview to frame the part of the shot you want.
- Press C, V and S to read it as Cable Length, Continuous VoD and Segmented VoD.
- Press 1 to focus the first hole. The chart frames it and the readout sets its planned figures beside what was recorded. Press 1 again to step through its zones.
- On Cable Length, press D and drag between two points to read a slope before you commit a zone.
- Press B to lay each hole's planned firing time over the trace.
- Press F for the full-screen workspace, where a card per zone sits beside the traces.
- Press Shift+R to read the toe of every hole side by side.
Where to go next
- Reading the trace: the three views, the overlays, the scale, and the timeline tracks.
- Measuring and zooming: zoom to a stretch, what is in view, the ruler, zoom and pan.
- Holes and zones: focusing, placing, making, editing and listing them, and undo.
- Blast timing: each hole's planned firing time over the trace, the deltas and the settings.
- Importing a blast plan: the import walk, replacing a plan, and saved mappings.
- Metrics and deviations: every figure, how it is worked out, flags, confidence and calibration.
- Comparing ranges: the same stretch of every hole, side by side.
- Reports and exports: the report, the zone CSV and the column ranges CSV.
- Full-screen workspace: the zone rail, the well and the blast overview beside the traces.
- Keyboard shortcuts: every key, generated from the analyser itself.
Seguir leyendo
Reading the trace
The three views of a VoD recording (cable length, continuous and segmented VoD), what each draws, the overlays, and the timeline tracks under the overview.
Measuring and zooming
Zoom to a stretch of the shot, read what is in view, measure between two points with the ruler, and zoom and pan with the mouse, trackpad or keyboard.
Holes and zones
Focus a hole or zone from the keyboard, place holes where the front entered each charge, mark the zones the VoD is fitted over, edit them, and undo.
Blast timing
Lay each hole's planned firing time over the trace, see how far each cut landed from it, and set the initiation system and offset the markers are read with.
Importing a blast plan
Bring the blast's design in from a CSV, Excel or DXF file: choose the file, check its columns, match each recorded hole to its planned one, and import. Nothing is saved until you do.
Metrics and deviations
What each VoD figure is and how it is worked out, why a hole's VoD is the mean of its zones, when a zone is flagged, how confidence is judged, and what cable calibration does.
Comparing ranges
Read the same stretch of every hole side by side: the toe, the middle, thirds or your own set, in a table sorted by any range and a profile up each column.
Reports and exports
Write and render the event's report, export the zone figures and the column ranges as spreadsheets, and download the processed trace.
Full-screen workspace
Press F to give the analyser the whole window: the traces on the left, and on the right a card per zone over a well that reads whatever you focus, or the whole blast.
Keyboard shortcuts
Every VoD Analyser shortcut, generated from the analyser's own actions so this page can never drift from the keys that fire, with the command palette and Help.