
Measuring and zooming
Zoom to a stretch of the shot, read what is in view, measure between two points with the ruler, and zoom and pan with the mouse, trackpad or keyboard.
A drag frames a window, on the Overview or on the detail chart itself. The (i) at the top right of the chart reads whatever that window holds. For a quick slope between any two points, press D for the ruler.
Zoom to a stretch
Drag across the detail chart on Cable Length or Continuous VoD, and it zooms to that stretch. A drag also lets go of any hole or zone you had focused. The chip at the top right of the chart then gives the zoom and the window's duration: click it, press A, or double-click the chart to go back to the whole record.
What is in view
Click the (i) at the left of the chip to open What is in view. It reads the first of these it finds: the zone you focused, the hole you focused, the window you framed, or the whole record. Its heading names the subject (Zone 2 · Hole 1, Hole 1 or Chart Selection), and its figures follow the view you are on. Metrics and deviations lists them view by view.
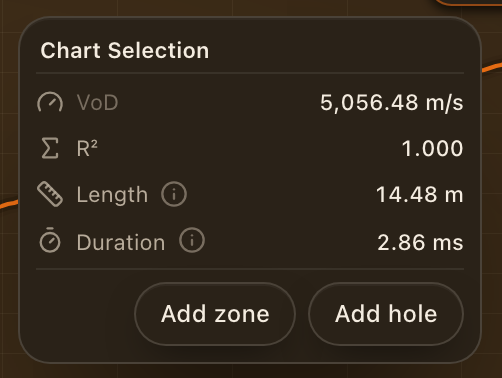
Under the figures, Add zone (N) turns the window into a zone, and Add hole (M) places a hole. Both open the dialog described in Holes and zones.
Measure between two points
On Cable Length, press D and drag between any two points on the trace. The readout gives the time between them (Δt), the cable consumed (Δ), and the velocity that slope implies (VoD est.). It is a quick check before you commit a zone. Press Esc or D again to leave the ruler. Changing view leaves it too.
Zoom
| Action | How |
|---|---|
| Frame a window | Drag across the Overview |
| Zoom to a stretch | Drag across the detail chart |
| Zoom in or out | + and -, or ⌘/Ctrl + scroll, or pinch |
| Zoom under the pointer | ↑ and ↓ while the pointer is over the plot |
| Reset the view | A or 0, double-click the chart, or click the zoom chip |
In the full-screen workspace a plain scroll zooms too. Resetting the view also lets go of any focus.
Pan
| Action | How |
|---|---|
| Drag to pan | Hold Space and drag |
| Nudge or glide | ← and → while zoomed (a tap nudges, holding glides) |
| Half a window | Shift+← and Shift+→ |
| Start or end of the record | Home and End while zoomed |
| Trackpad | Shift + scroll, or a two-finger swipe |
When the chart is not zoomed, ← and → move to the previous and next event instead, as K and J do.
Cursor pills follow the pointer along the axes and read the exact values at that sample.