
Reports and exports
Export zone metrics as a spreadsheet, download the trace or the raw recording, view and edit the report, generate the PDF, and re-analyse on a newer engine.
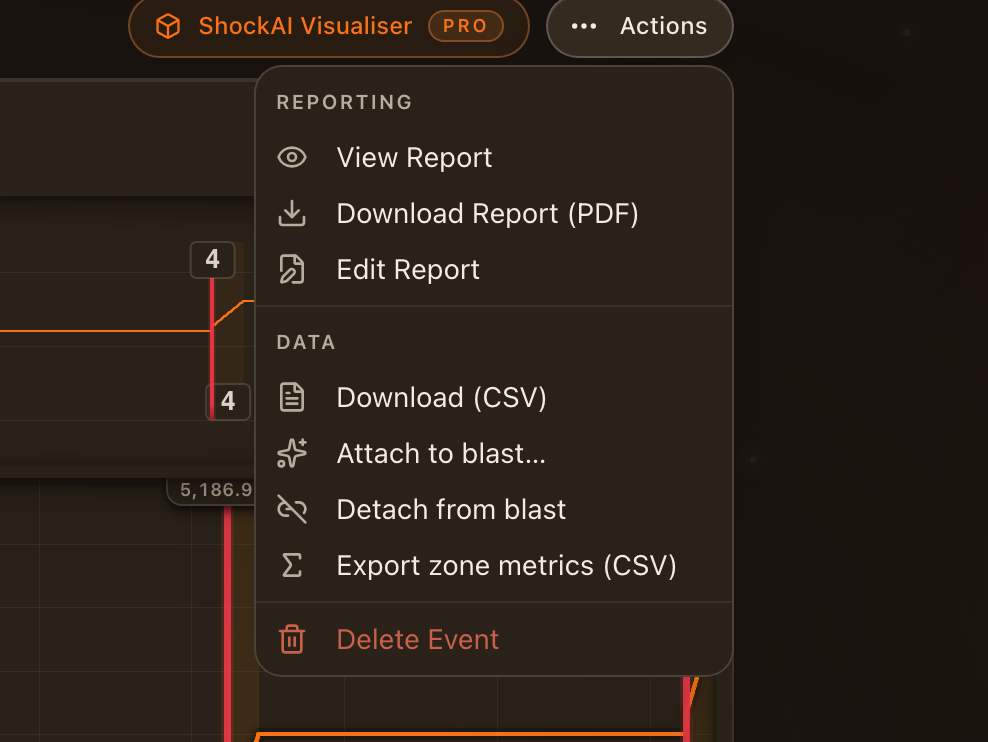
The event actions menu in the page header groups everything that leaves the analyser. Rename the event, add a note or tags from the same menu.
Data
- Export zone metrics (CSV), or Shift+E, writes one row per zone in SI units: hole, zone, VoD, R², length, duration, the deviations and the confidence tier. It is the same model the page reads from.
- Download (CSV) exports the processed trace.
- Download file gives you the raw recording exactly as the unit sent it (a
.vodminifile).
Reporting
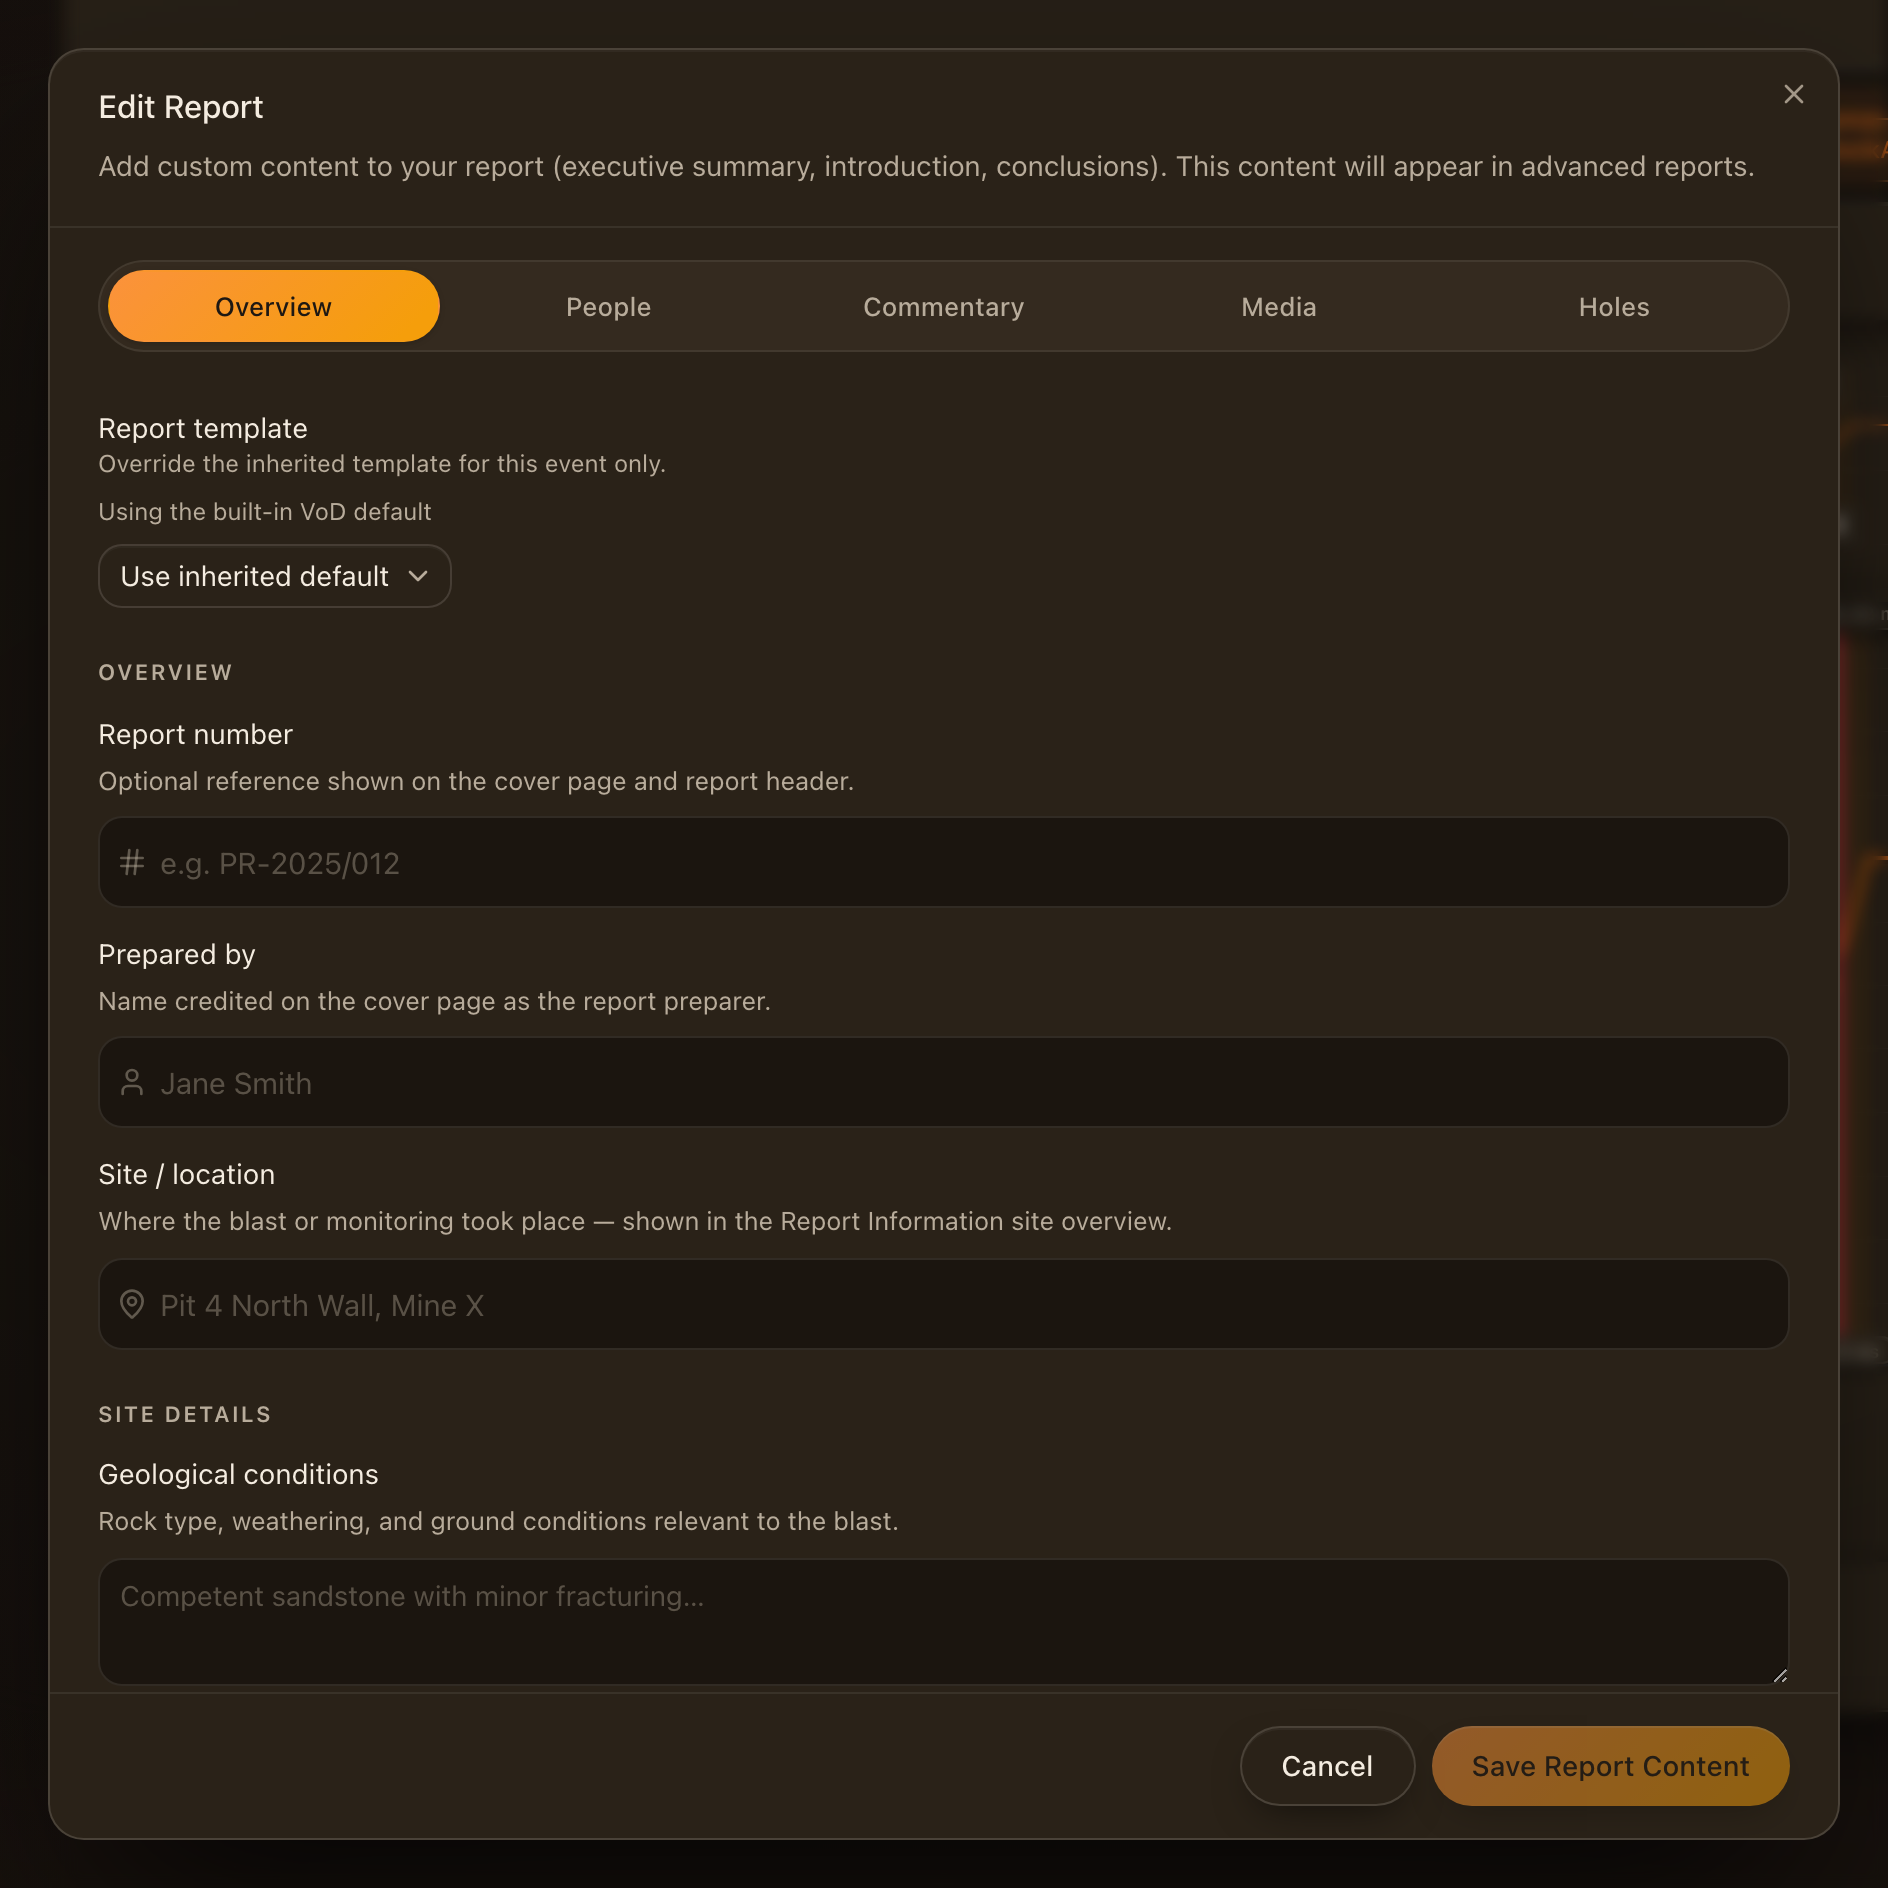
- Edit Report opens the report content editor over the event: overview, people, narrative, media and holes, each on its own tab. Saved content also appears in the account's Reports list.
- View Report opens the rendered report in a new tab, exactly as the PDF prints.
- Download Report (PDF) renders the report with the project's template.
The rendered report
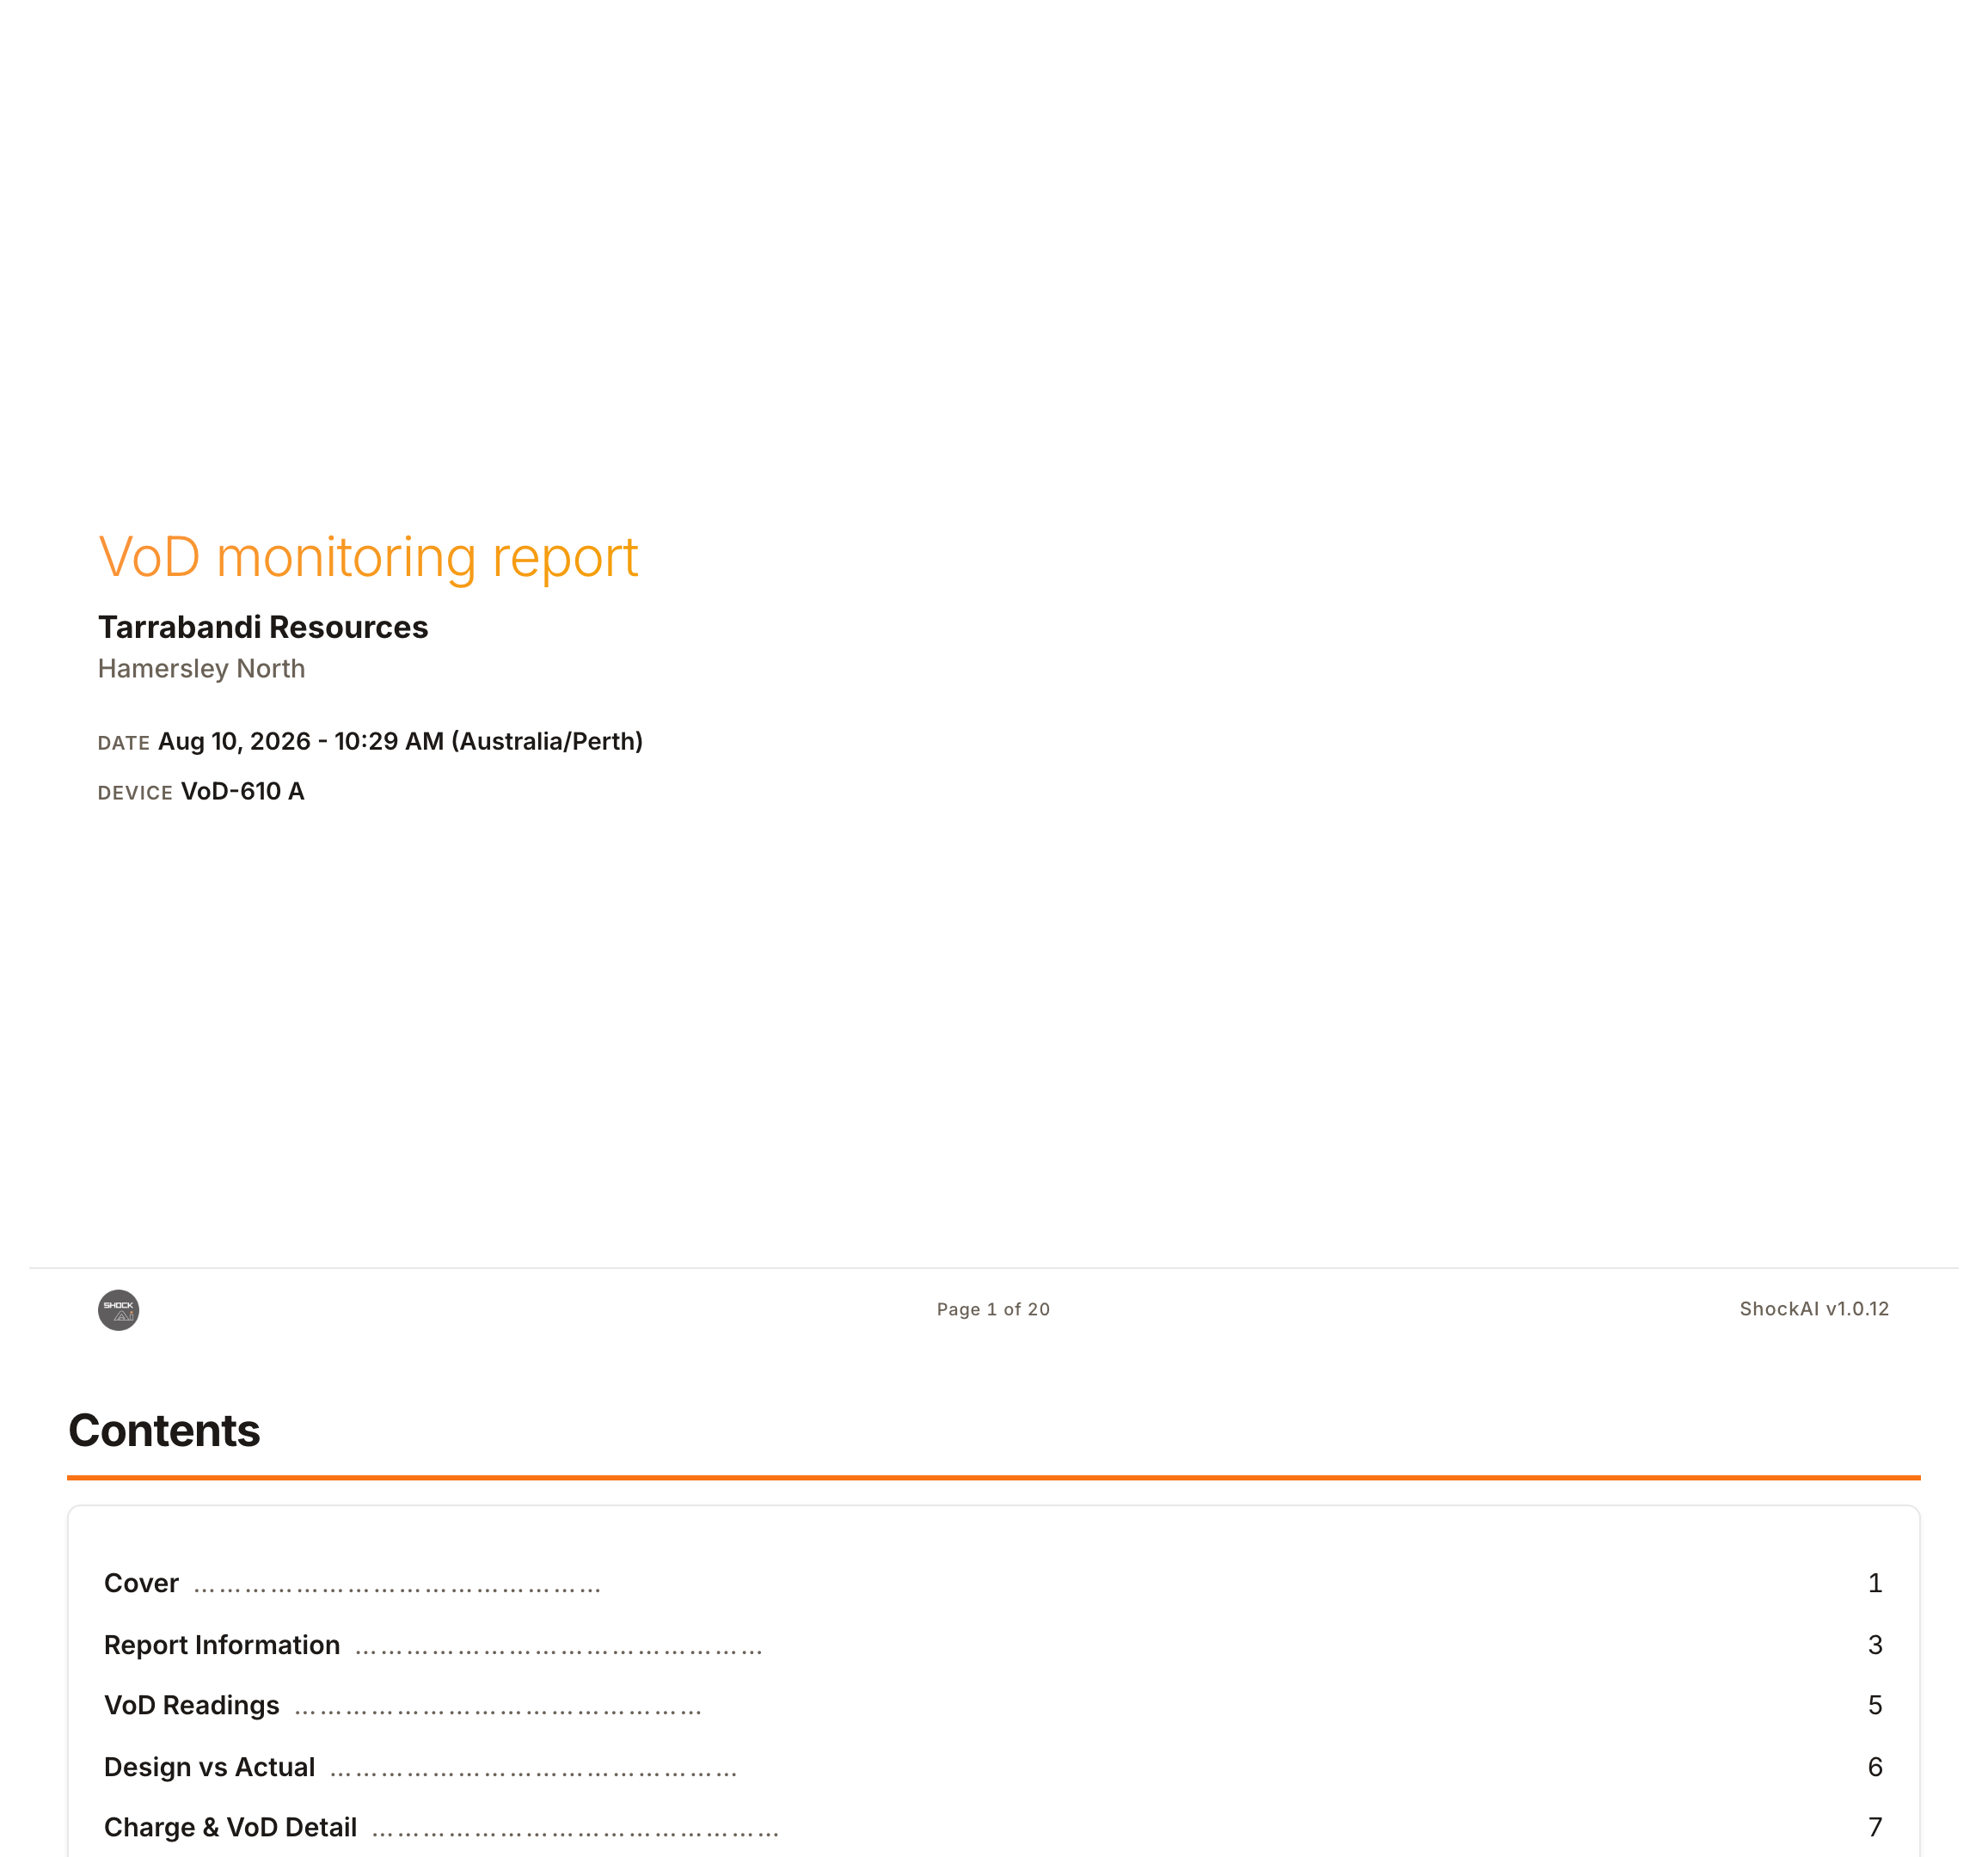
The preview is the report as it prints: the cover, the design against the actual, and one page per hole with its zones. Report Studio is where the template is designed.
Reports are part of the paid plans. On a plan without them the menu offers the upgrade instead.
Re-analysis and engine versions
Every event records the engine version that processed it. When a newer engine is available, the page offers Update event data; Re-analyse Event re-processes the raw recording with the latest engine. Continuous VoD can also be recomputed on its own when the underlying calculation improves. Re-analysis recomputes every derived figure and can remove annotations that no longer fit the new trace, so the dialog warns you first. The previous artifact is kept for audit.