Views and focus
Choose between cable length, continuous VoD and segmented VoD, and focus on one hole or zone so every panel reads the same thing.
The detail chart reads the same recording three ways, and focus decides which part of the shot every panel is talking about.
The three views
| View | Key | What it shows |
|---|---|---|
| Cable Length | C | The raw trace: cable consumed against time. The slope of this line is the VoD. |
| Continuous VoD | V | The instantaneous slope of the cable trace, so you can see the front run up to speed, hold it and stop. |
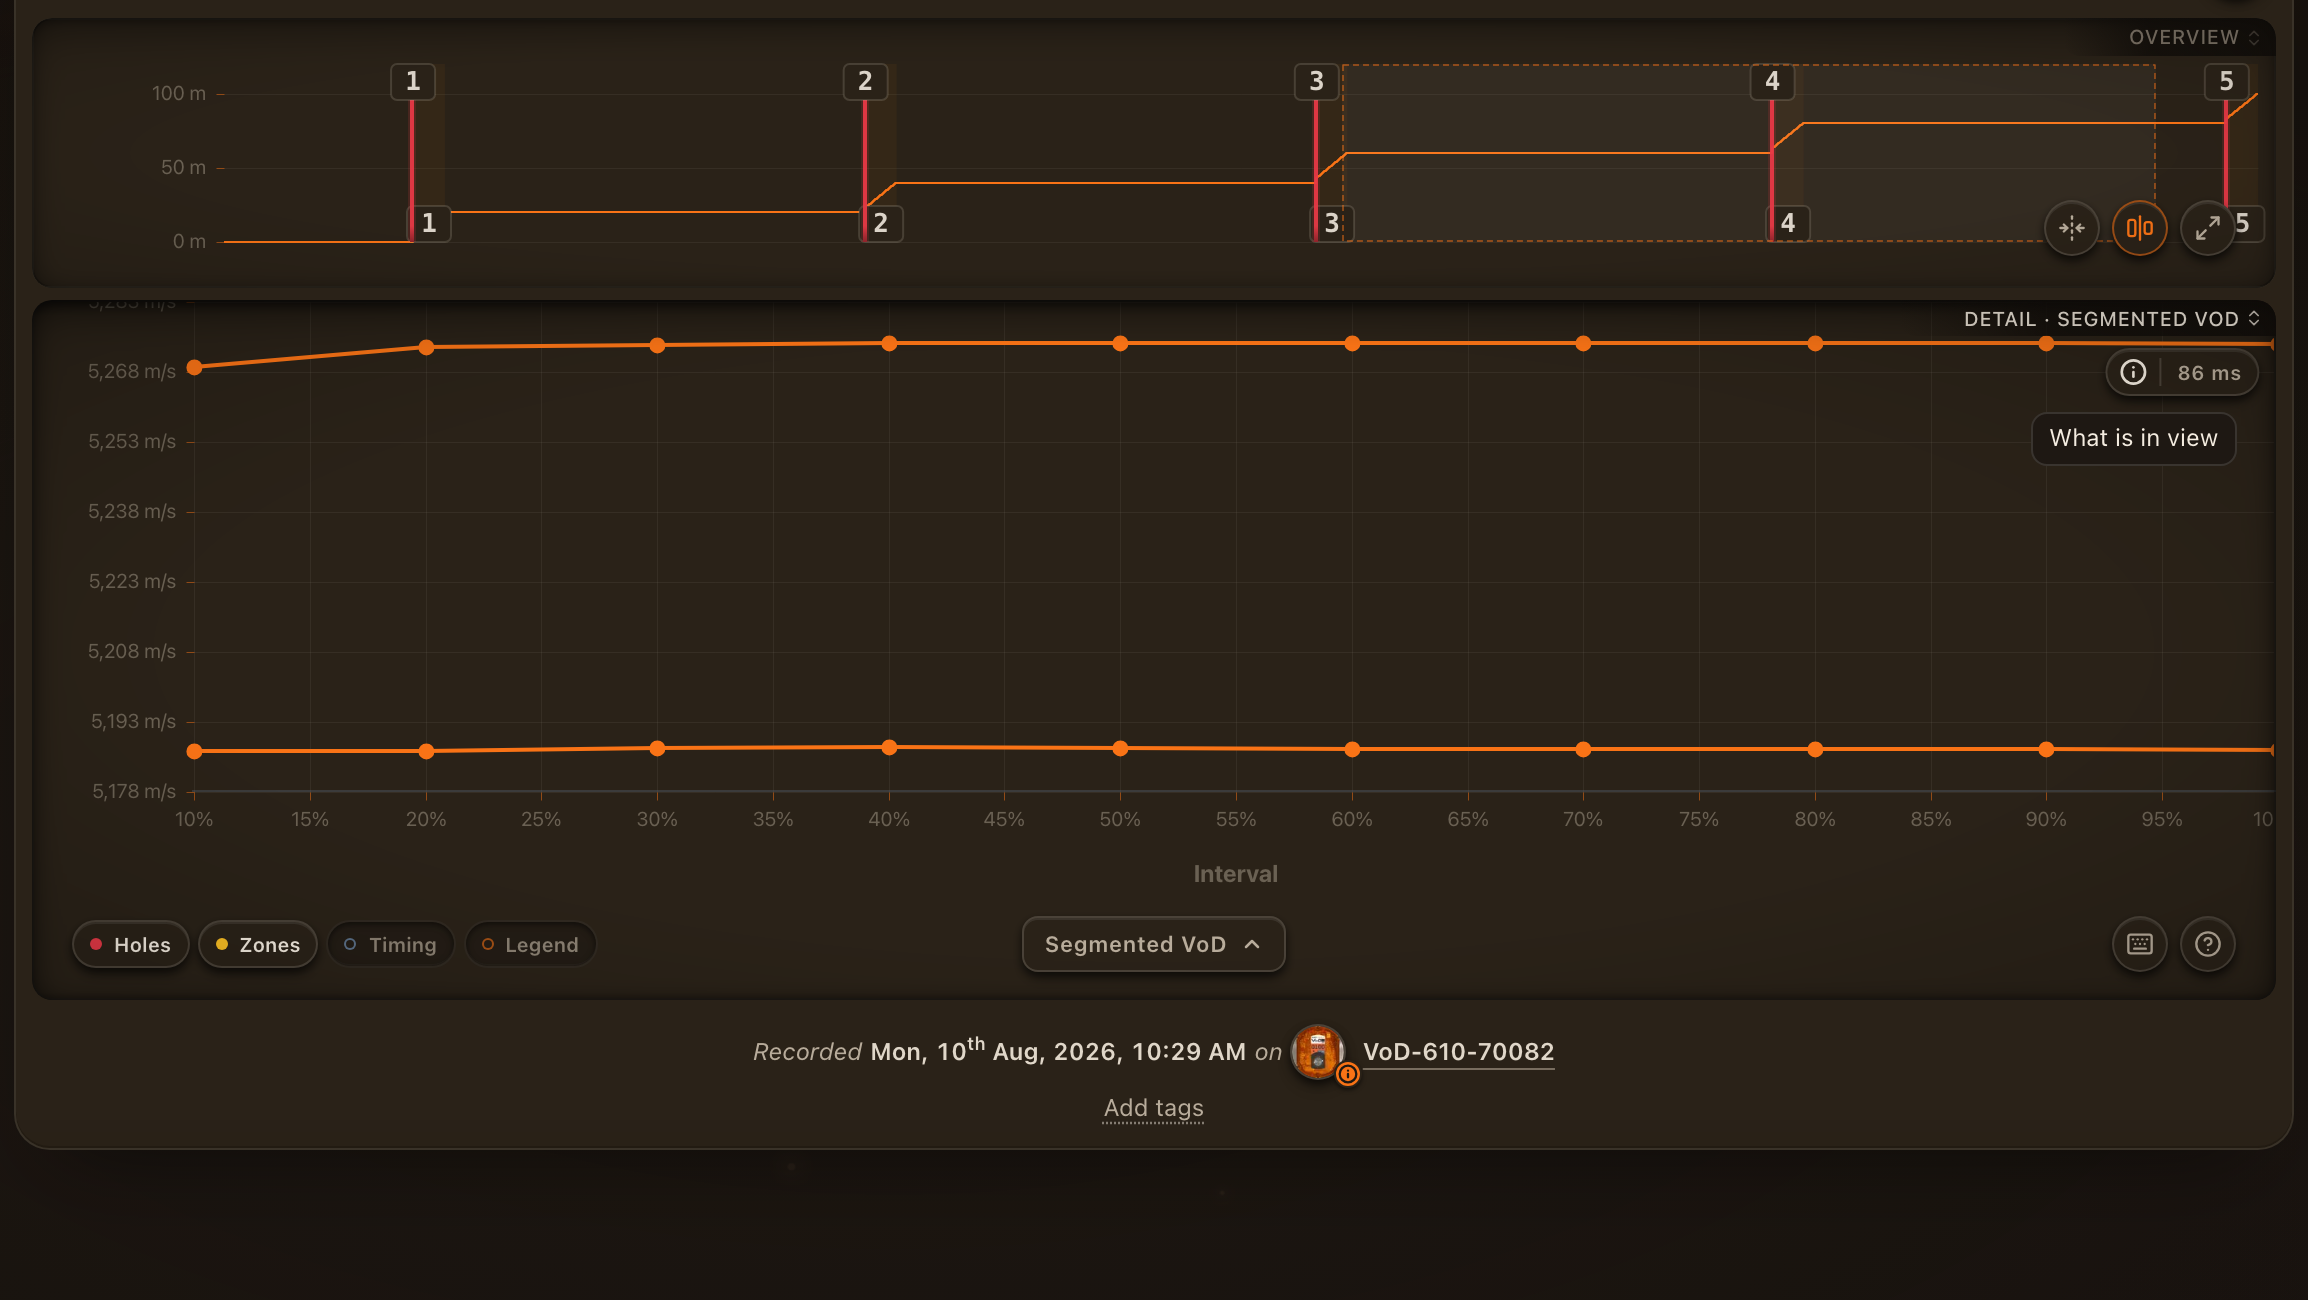
| Segmented VoD | S | One figure per interval: the cumulative VoD from each zone's start to ten equally spaced points along it. |
Press , and . to step through the views, or click the chart title to cycle them. In the full-screen workspace, < and > cycle the review view as well.
Zone shading, hole markers and the timing overlay draw on every view. A dashed line across a hole's zones on the continuous views is the product's planned VoD from the blast plan.
Focus
Focus is a pinned hole, or a hole and one of its zones. Everything follows it: the chart frames it, the focus readout shows its figures, the zone rail highlights it and the well in full screen reads it.
- Press 1 to 9 to focus a hole by its row. Press the same digit again to step through that hole's zones.
- Press
Q W R T Y U I O Pto jump to zone 1 to 9 directly (the letter row above the digits, E excluded because it edits). - Press Enter to open the details dialog for the focused hole, or E to edit the focused hole or zone.
- Press Esc to let go of one layer at a time: a zone back to its hole, then the hole, then the zoom.
- Click a hole marker or a zone band on the chart, or a card on the zone rail, to focus with the mouse.
On the page, focusing a zone frames the zone on the chart. In full screen the chart holds the whole hole and the review column's well shows the zone, so you never lose the context of the deck next to it.
Overlays

The toolbar toggles, and their keys, control what is drawn over the trace: holes (H), zones (Z), the blast timing markers (B) and the legend (L). Shift+D labels the timing deltas between holes.
Reading a single figure
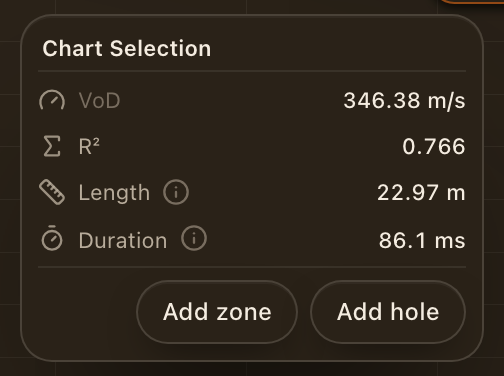
Hover the trace for the cursor readout. Click the (i) on the detail chart, or Show selection metrics, to read the figures for the current context: a focused zone, a focused hole, or the chart selection. See Metrics and deviations for what each one means.