
VoD Analyser
Read a velocity-of-detonation recording: cable length, continuous and segmented VoD, focus on a hole or zone, compare against the blast plan, and export the figures.
The VoD Analyser opens one VoD event: the record of how much probe cable the detonation consumed over time as the front travelled down each hole. From that one trace it gives you a velocity of detonation for every charged deck, for every hole and for the shot as a whole, and shows how each compares with the plan.
Open it from any VoD event in a project or session. The first time you do, a short tour points out the main parts; replay it from the Help button on the toolbar.
What is on the page
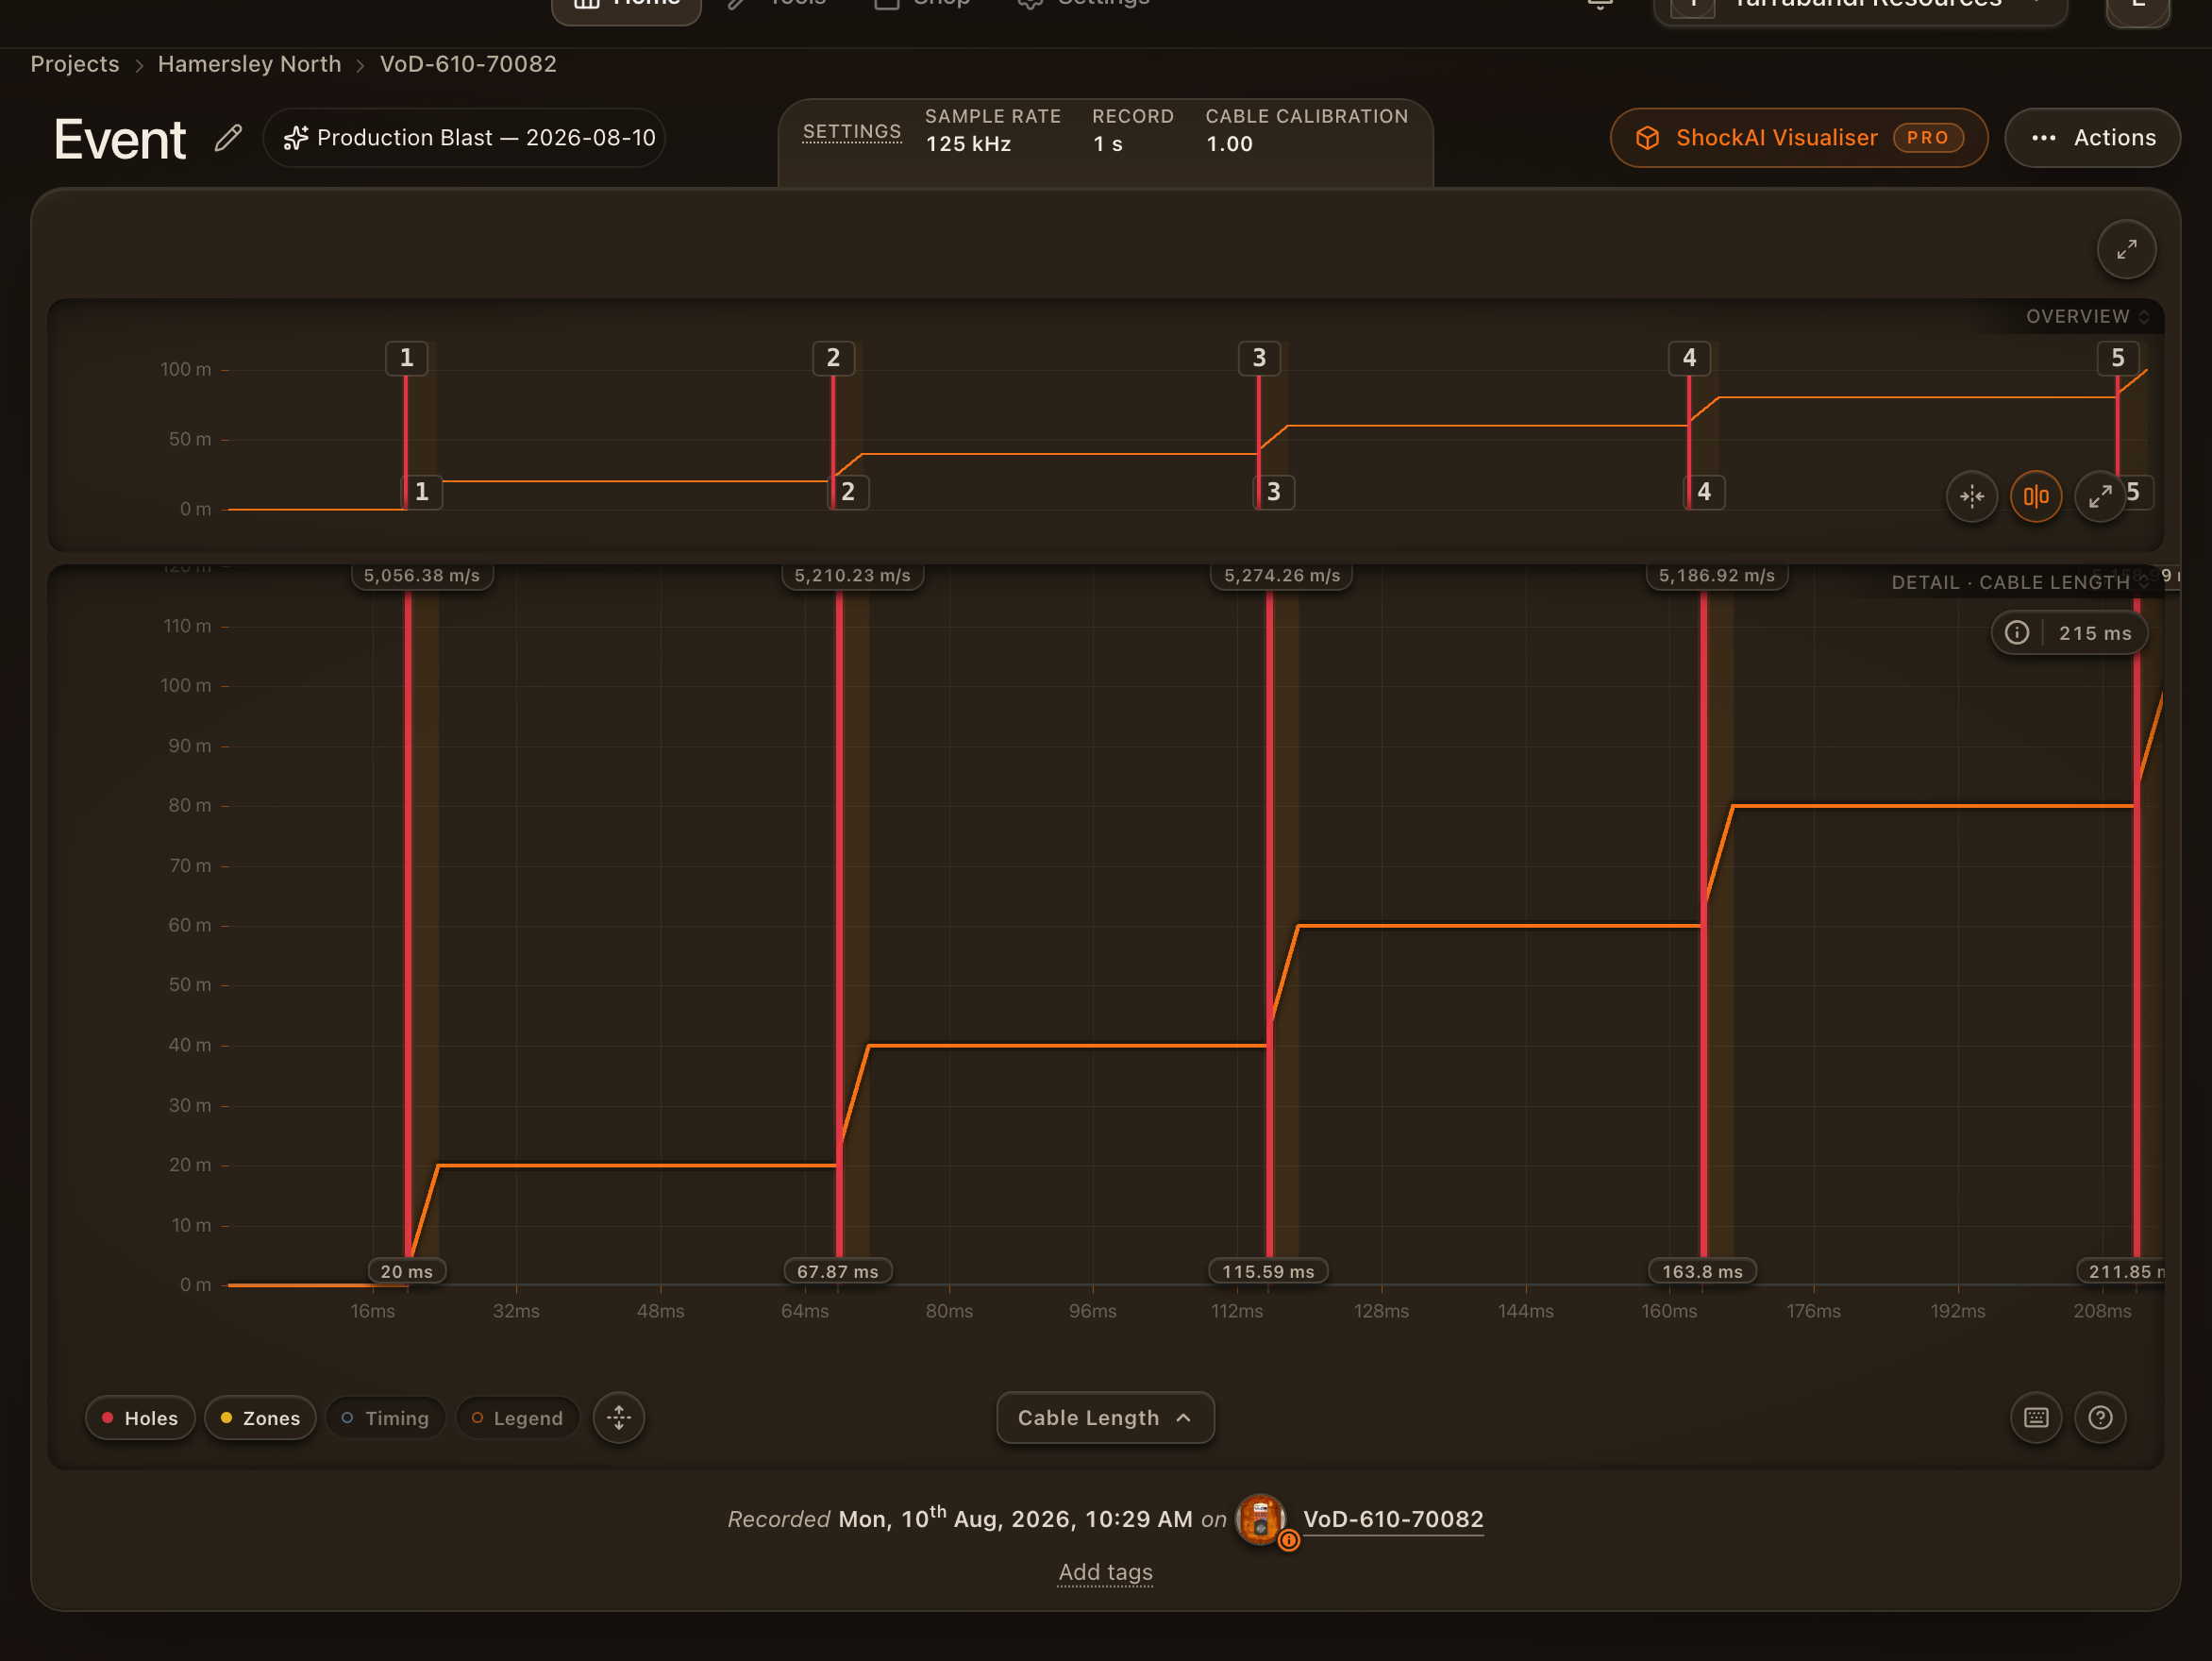
- Overview at the top spans the whole shot. Drag across it to choose the window the detail chart shows. Press Shift+O to swap it for the navigator tracks for holes, timing and zones.
- Detail chart shows your window in one of three views: Cable Length, Continuous VoD or Segmented VoD.
- Toolbar above the detail chart holds the view switch, the overlay toggles, the measure ruler, the selection metrics, the shortcuts sheet and Help.
- Focus readout appears when you focus a hole or a zone, with its planned and recorded figures.
- Event information and the location panel sit beside the charts with the unit's settings, including the cable calibration.
- Event actions menu in the page header holds downloads, reports and re-analysis.
A first pass through a shot
- Press 1 to focus the first hole. The chart frames it and the readout shows its planned and recorded VoD, depth, stemming, column and primer position.
- Press 1 again to step through that hole's zones, or Q, W, R… to jump straight to zone 1, 2, 3.
- Press V for Continuous VoD to see how the front accelerated and settled, then S for Segmented VoD to see the ten-interval breakdown of each zone.
- Press D, then drag between two points, to read a slope by hand before you commit to a zone.
- Press F for the full-screen workspace, where the review column lists every zone beside the traces.
Where to go next
- Views and focus: the three views and how focus works.
- Holes and zones: placing, creating, editing and stepping through annotations.
- Importing a blast plan: the import wizard and saved column mappings.
- Metrics and deviations: how every figure is read and when a zone is flagged.
- Reports and exports: CSV, the zone metrics export, PDF and re-analysis.
- Full-screen workspace: traces beside the review column.
- Keyboard shortcuts: every key, generated from the analyser itself.
Continue reading
Views and focus
Choose between cable length, continuous VoD and segmented VoD, and focus on one hole or zone so every panel reads the same thing.
Holes and zones
Place holes where the front entered each charge, mark the zones the VoD is fitted over, edit them precisely, and step through them from the keyboard.
Importing a blast plan
Bring the drill and charge design into the analyser from a CSV or Excel file, map its columns once and reuse the mapping, and match each recorded hole to its row.
Metrics and deviations
How every VoD figure on the page is read, why a hole's VoD is the mean of its zones, when a zone is flagged, and what cable calibration means.
Reports and exports
Export zone metrics as a spreadsheet, download the trace or the raw recording, view and edit the report, generate the PDF, and re-analyse on a newer engine.
Full-screen workspace
Press F to give the analyser the whole window: peek tabs above two resizable columns, traces on the left and the zone review on the right.
Keyboard shortcuts
Every VoD Analyser shortcut, generated from the analyser's own action registry so this page can never drift from the keys that fire.