
ViB Analyser
Read a vibration and airblast recording: the traces and spectra, measuring and zooming, zones, holes and timing, and compliance against your project's standards.
The ViB Analyser opens one vibration event: a triggered recording of ground motion on three axes, with airblast when the unit has a microphone. It turns that recording into figures you can defend: peak particle velocity, dominant frequency, the peak vector sum, and a verdict against the standards your project uses.
Watch a first pass
The walkthrough is chaptered. Each page in this section opens with its own chapter, so you can watch the part you need and read the rest.
What is on the page
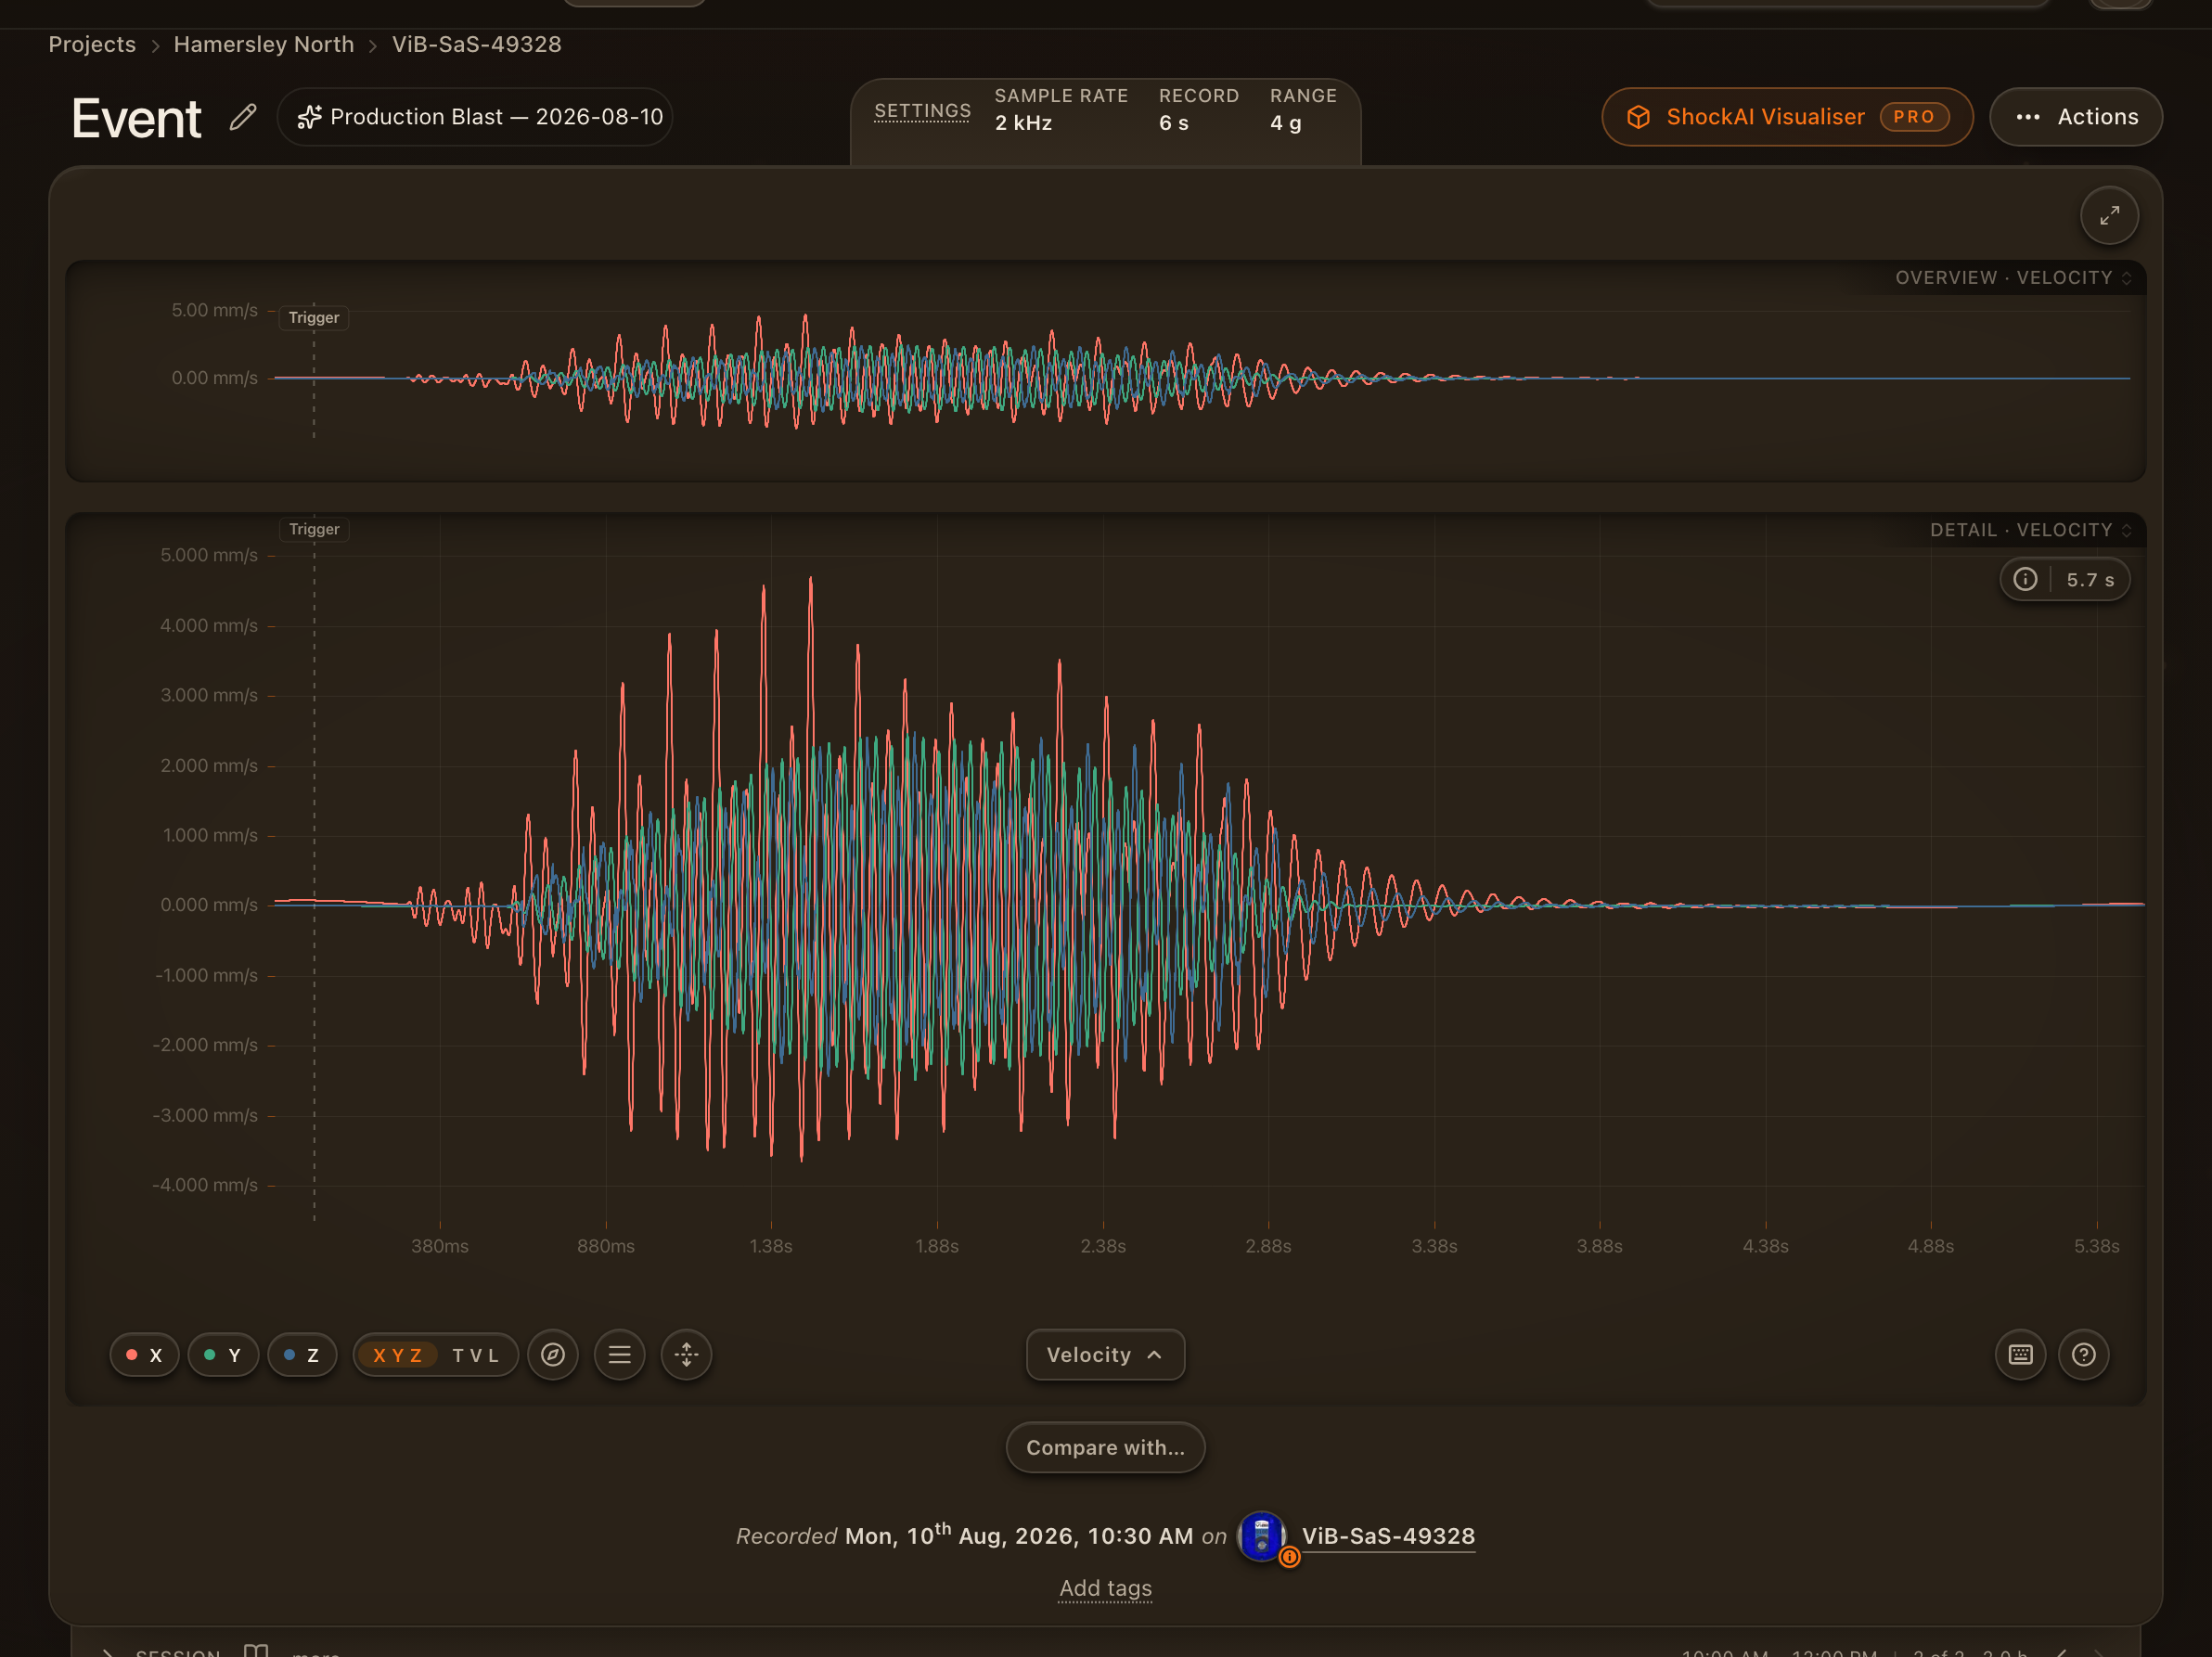
- Overview at the top spans the whole recording. Drag across it to choose the window the detail chart shows. Press O to swap it for the navigator: three rails for holes, zones and timing.
- Detail chart shows your window at full sample resolution in one of five views: Acceleration, Velocity, Displacement, Frequency or Particle motion.
- Toolbar above the detail chart holds the view switch, the axis pills, the overlay toggles, the What is in view readout, the keyboard shortcuts sheet and Help.
- Compliance sits under the detail chart when your project has limit curves set. It scores the event against each applicable limit and explains the verdict.
- Compare with…, under the charts on an event linked to a blast, lays a seismograph record from the same blast over this event. See Seismograph records.
- Session drawer at the bottom places this event among its neighbours in the same monitoring session.
- Event actions menu in the page header holds downloads, reports and re-analysis.
Open the analyser from any ViB event in a project or session. The first time you do, a short tour points out the main parts. You can replay it, and every other tour, from the Help button on the chart toolbar.
The moves that matter
- Drag across the Overview to frame the arrival. The detail chart follows.
- Press V for Velocity. Most limits are written in peak particle velocity, in mm/s.
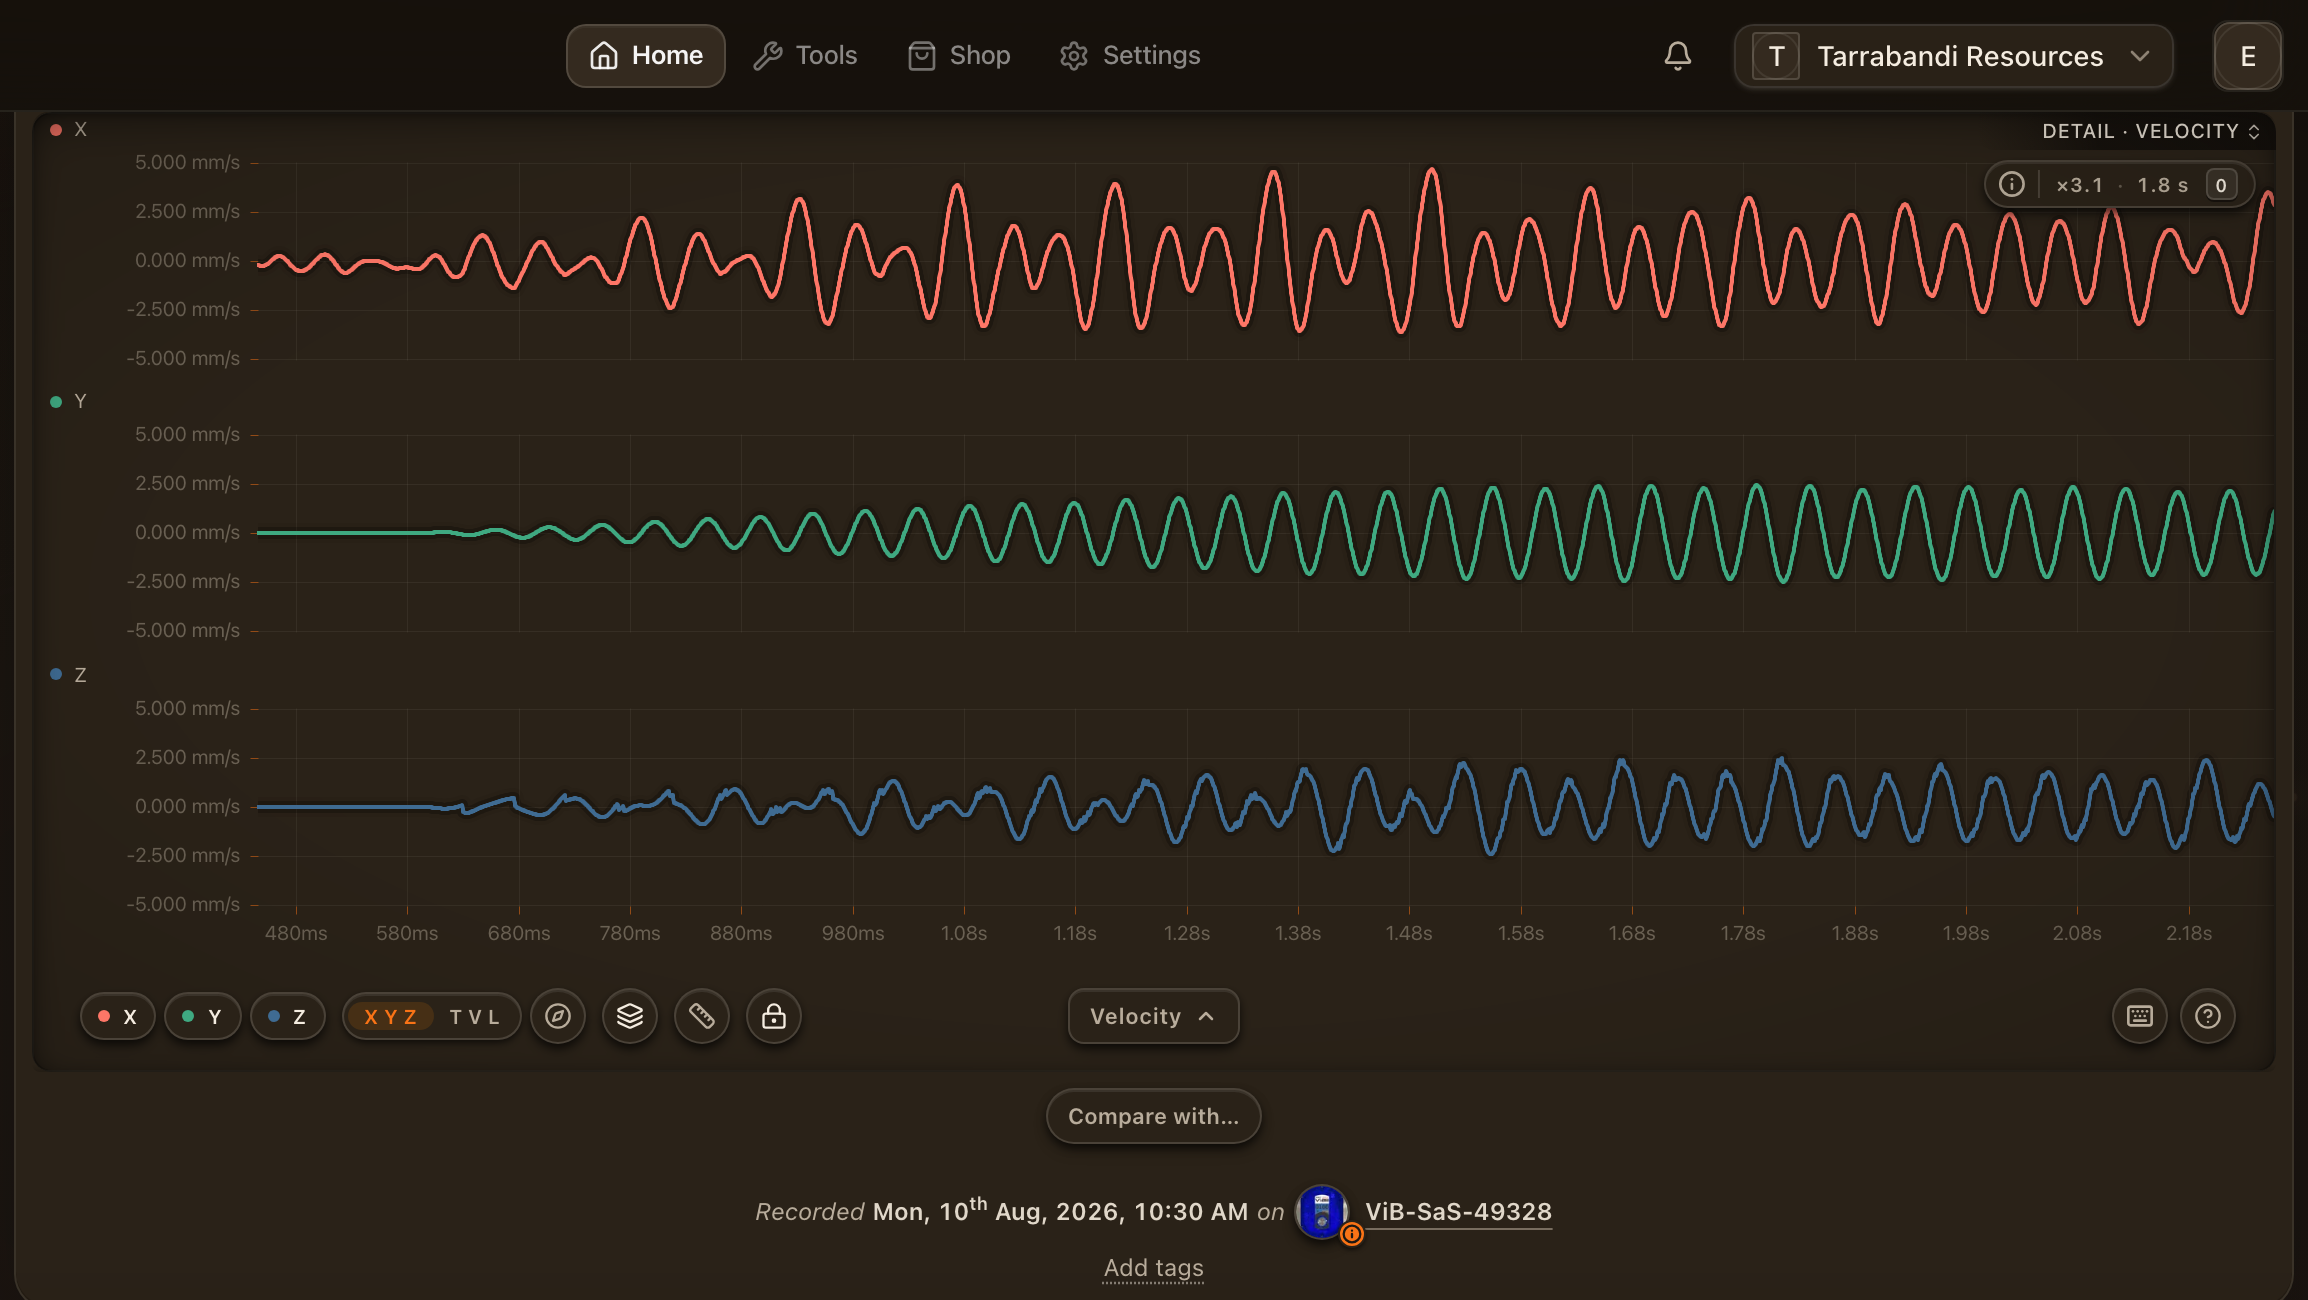
- Press X to stack the axes, one pane each, and Shift+Y to put them on one scale, so heights compare across panes.
- Drag across the detail chart to measure a span. The readout gives each channel's peak, frequency and RMS for that span. Press Enter to zoom to it.
- Press Q for Frequency to see where the energy sits. The same velocity does different damage at 5 Hz and at 50 Hz.
- Scroll to Compliance for the verdict, or press F for the full-screen workspace, where compliance sits beside the traces.
Where to go next
- Reading the traces: the five views, overlaid or stacked traces, scales and axes.
- Measuring and zooming: the measured span, zoom and pan.
- Zones, holes and timing: the navigator rails and the blast-plan and timing imports.
- Compliance and standards: what is scored, against which curves, and how to read each card.
- Particle motion: the three channels as one path.
- Session drawer and histogram: the event among its neighbours.
- Reports and exports: PDF, CSV and the raw file.
- Full-screen workspace: peek tabs and two resizable columns.
- Keyboard shortcuts: every key, generated from the analyser itself.
Continue reading
Reading the traces
Switch between acceleration, velocity, displacement, frequency and particle motion, overlay or stack the axes, choose how the scales behave, and isolate a single channel.
Measuring and zooming
Measure a span of the trace, read what is in view, and zoom and pan with the mouse, trackpad or keyboard.
Zones, holes and timing
Carve the recording into zones, place blast-plan holes at their firing times, and overlay the initiation sequence from your detonator system.
Compliance and standards
Which limit curves the event is scored against, how the verdict is reached, and how to read the PPV, airblast, margin, summary and history cards.
Particle motion
Press P to see the three channels as one path: the ground particle's own scribble, with the peak vector sum as its farthest excursion and the first motion as a placement check.
X Y Z, and Tran Vert Long
Why the channels read X, Y and Z, how a true transverse, vertical and longitudinal frame is resolved from the record itself, and how to check or correct it in the Orientation dialog.
Session drawer and histogram
See this event among its neighbours in the monitoring session, read the peak-hold band against the trigger level, and step between events without leaving the analyser.
Reports and exports
Download the processed data as CSV or the raw recording, view and edit the report, generate the PDF, and re-analyse an event on a newer engine.
Full-screen workspace
Press F to give the analyser the whole window: peek tabs above two resizable columns, traces on the left and compliance on the right, with nothing to scroll.
Keyboard shortcuts
Every ViB Analyser shortcut, generated from the analyser's own action registry so this page can never drift from the keys that fire.