
Comparing a seismograph with a ShockAI unit
Lay a seismograph record over a ViB event in the analyser: one clock from the waveforms, one frame once the unit is oriented, the difference per component, and adjusting the alignment.
A seismograph beside a ShockAI unit recorded the same ground motion through a different sensor, on a different clock, and usually in a different frame. The ViB Analyser puts the two on one clock and, once the unit is oriented, in one frame, then says how far apart their figures are.
Open a record against an event
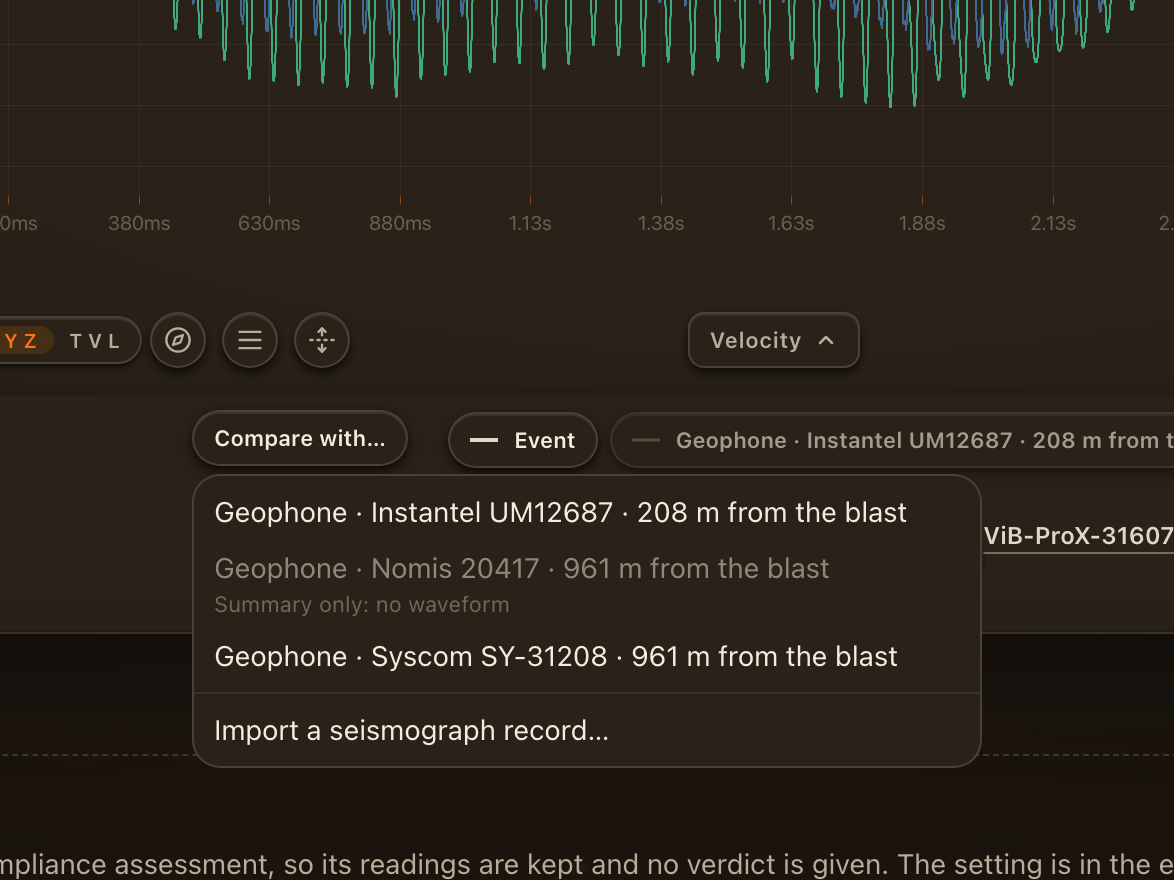
There are three ways in:
- From the blast page, Open in analyser on a paired record opens its unit's event with the record already laid over it.
- On a ViB event, the paired record is in the legend under the charts, dimmed until it is loaded: click it to load it.
- Compare with…, under the charts, lists every seismograph record on the event's blast, the paired one first. Tick one to lay it over this event, or untick it to take it away. A record that cannot be drawn says why: Summary only: no waveform, or Not scored yet.
For people who can edit the project, Import a seismograph record… at the foot of the menu opens the import walk with this event already chosen as the pair.
The legend then names both datasets: the event, and the seismograph by make, serial and distance from the blast, drawn dashed. Click either to hide it; Alt-click one to show only that one.
One clock
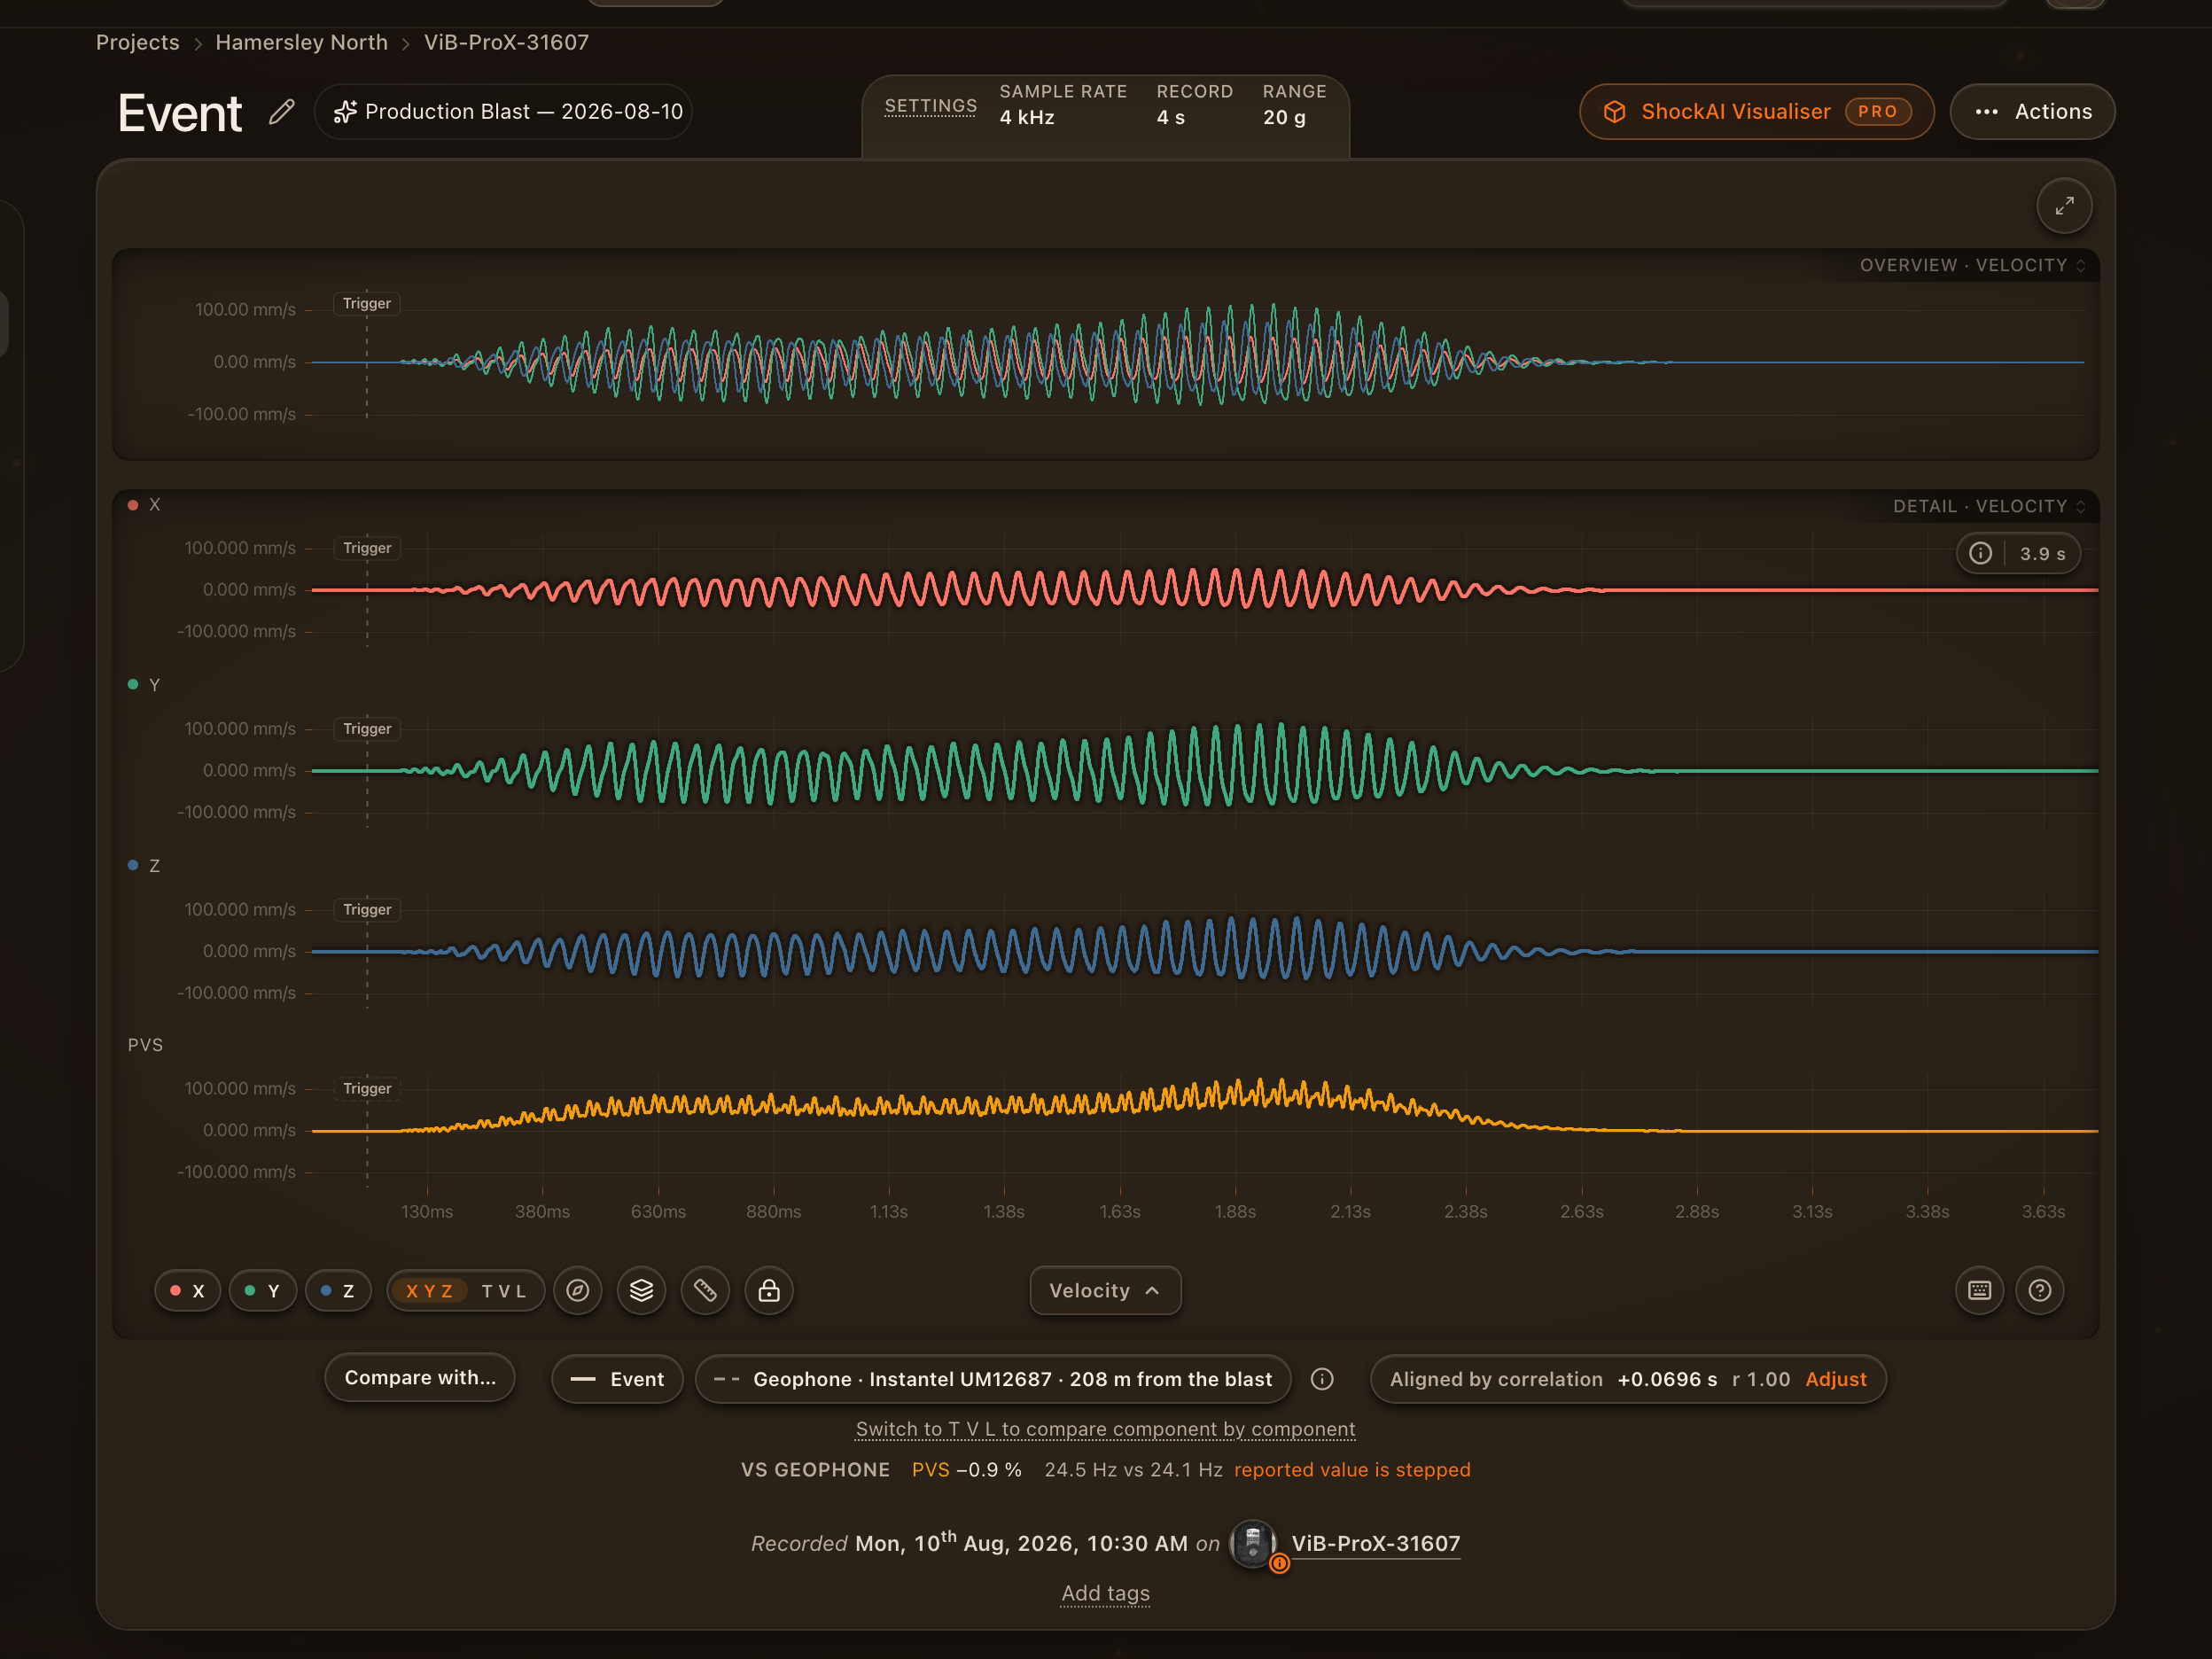
A seismograph keeps its own time, often seconds or minutes out, so the two records are not lined up by their clocks. They are lined up by their waveforms: the shape of the two vector sums over time is matched, which works whichever way either instrument was lying. The chip under the charts says how it was done:
- Aligned by correlation, with the shift and a score (r) from 0 to 1. A score close to 1 means the two records are the same motion.
- By clock, when the waveforms could not be matched, for example when one record missed most of the event. Treat any comparison made this way with care.
- Set by hand, when someone saved an adjustment (see Adjust the alignment).
A seismograph also records at its own rate, often 1024 or 2048 samples a second. The analyser brings it onto the unit's samples before it compares anything, filtering it first if it recorded faster than the unit.
Compared on the vector sum
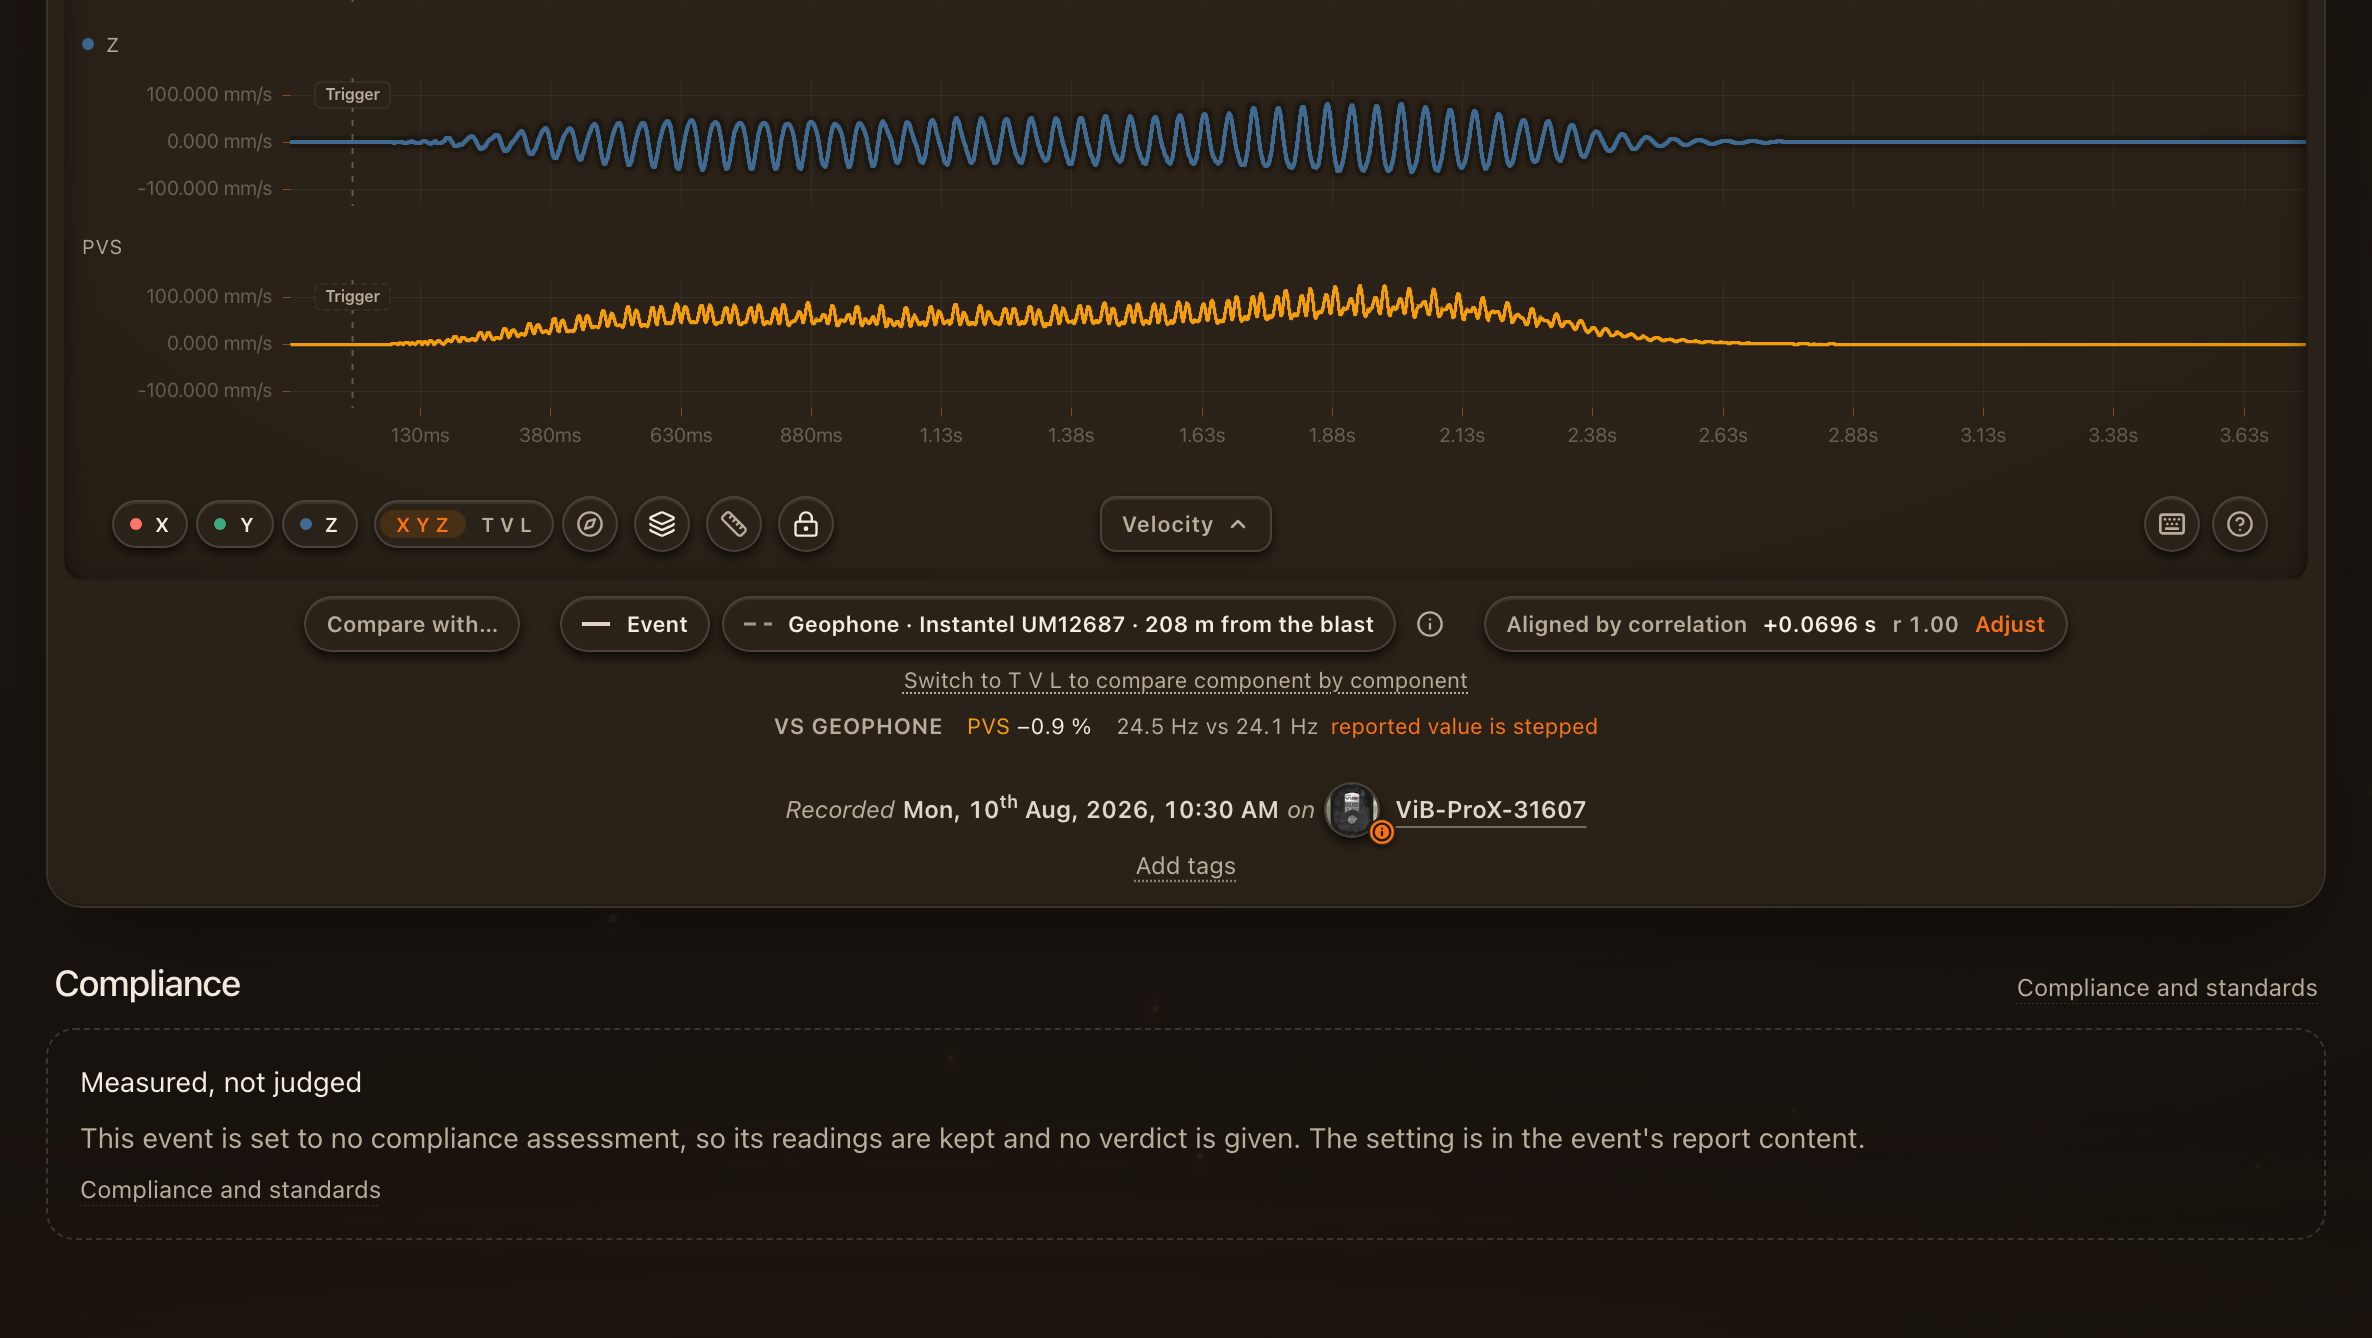
A geophone records Tran, Vert and Long. While the unit reads X Y Z, its channels are its own axes, not the geophone's, so no channel can be compared with a geophone channel. The two are compared on the peak vector sum, which does not depend on how either instrument was lying, and the geophone is drawn as its vector sum beside the unit's.
The line under the charts says what would compare them component by component. When the unit's orientation is resolved it offers Switch to T V L to compare component by component, one click; when it is not, it asks for the orientation and opens Orientation, where it can be resolved. See Frames and orientation.
Component by component
Switch to T V L and the unit's record is turned into Tran, Vert and Long, the geophone's own frame. The geophone's three traces are drawn over the unit's, and each component is compared. A unit that lay tilted and turned compares with an aimed geophone as well as one set level and aimed: that is what turning its record into the ground's frame is for.
What the row says
The row under the charts, vs geophone, gives:
- the difference for each component, Tran, Vert and Long, when both records are in one frame;
- the difference in PVS, the peak vector sum, always;
- the unit's dominant frequency against the geophone's.
Every difference is the unit's figure against the seismograph's, as a share of the seismograph's figure: −1.0 % means the unit read 1 % less. reported value is stepped marks a frequency the seismograph printed in whole-sample steps; hover it for the step. In full screen the same figures are in the Readings tab.
Adjust the alignment
Adjust, on the alignment chip, nudges the seismograph along the time axis: the arrow keys move it one sample, Shift and an arrow move ten. The chip shows the shift in seconds and in samples as you go. Save keeps it for everyone, for people who can edit the project; a saved shift is marked set by hand and is never replaced by an automatic alignment. Cancel puts it back. Without edit rights, Done keeps the shift for what you are looking at and Reset puts it back.
Adjust only when the automatic alignment is plainly wrong, such as a score well below 1 or arrivals visibly out of step. The shift moves the comparison, never either record's own figures.
Frame agreement
For a geophone whose Long axis was aimed at the blast, paired with a unit whose record has been turned into Tran, Vert and Long, the record's sheet shows Our Long against the geophone's: the angle between the two Long axes, found from the two waveforms after they are lined up. Vendors differ in which way they count Long and Tran as positive, so the angle is folded to within 90° either side.
No compass is involved on either side, so a small angle, a few degrees, is independent evidence that the unit's frame was resolved correctly on your ground. A large one says that one of the two was not where it was said to be: the geophone not aimed, or the unit's orientation worth checking in Orientation.
Why the two instruments differ
Two good instruments side by side rarely read exactly the same. The usual reasons, most likely first:
- They were not quite side by side. A few metres apart is different ground to a vibration: a different footing, a different depth of soil. The further apart, the larger the difference.
- Coupling. A sensor that is spiked, buried, sandbagged or stood on a slab moves with the ground differently, especially at higher frequencies and on a strong shot.
- The sensors. A geophone measures velocity directly; an accelerometer's velocity is worked out from acceleration. Each is least faithful at the low end of its range, so records rich in low frequencies differ most.
- Sample rate and frequency. A seismograph sampling more slowly can miss the very top of a short peak, and prints its frequency in whole-sample steps. The analyser marks a stepped frequency.
- Clock and trigger. A record that triggered late misses its first arrivals; a comparison aligned by clock may not be comparing the same instants.
When a pair disagrees by more than you expect, check the alignment score, the separation and the coupling notes before anything else.
A record with no pair
A record whose seismograph stood where no ShockAI unit did has its own page, from Open in analyser on the blast page: its three traces over time, its figures and its instrument. Compare with… can still lay it over any event on the blast, lined up by the clocks. That puts the two on one time axis for reading, but it is not a side-by-side comparison, and the difference means little.