
Compliance and standards
Which limit curves the event is scored against, how the verdict is reached, and how to read the PPV, airblast, margin, summary and history cards.
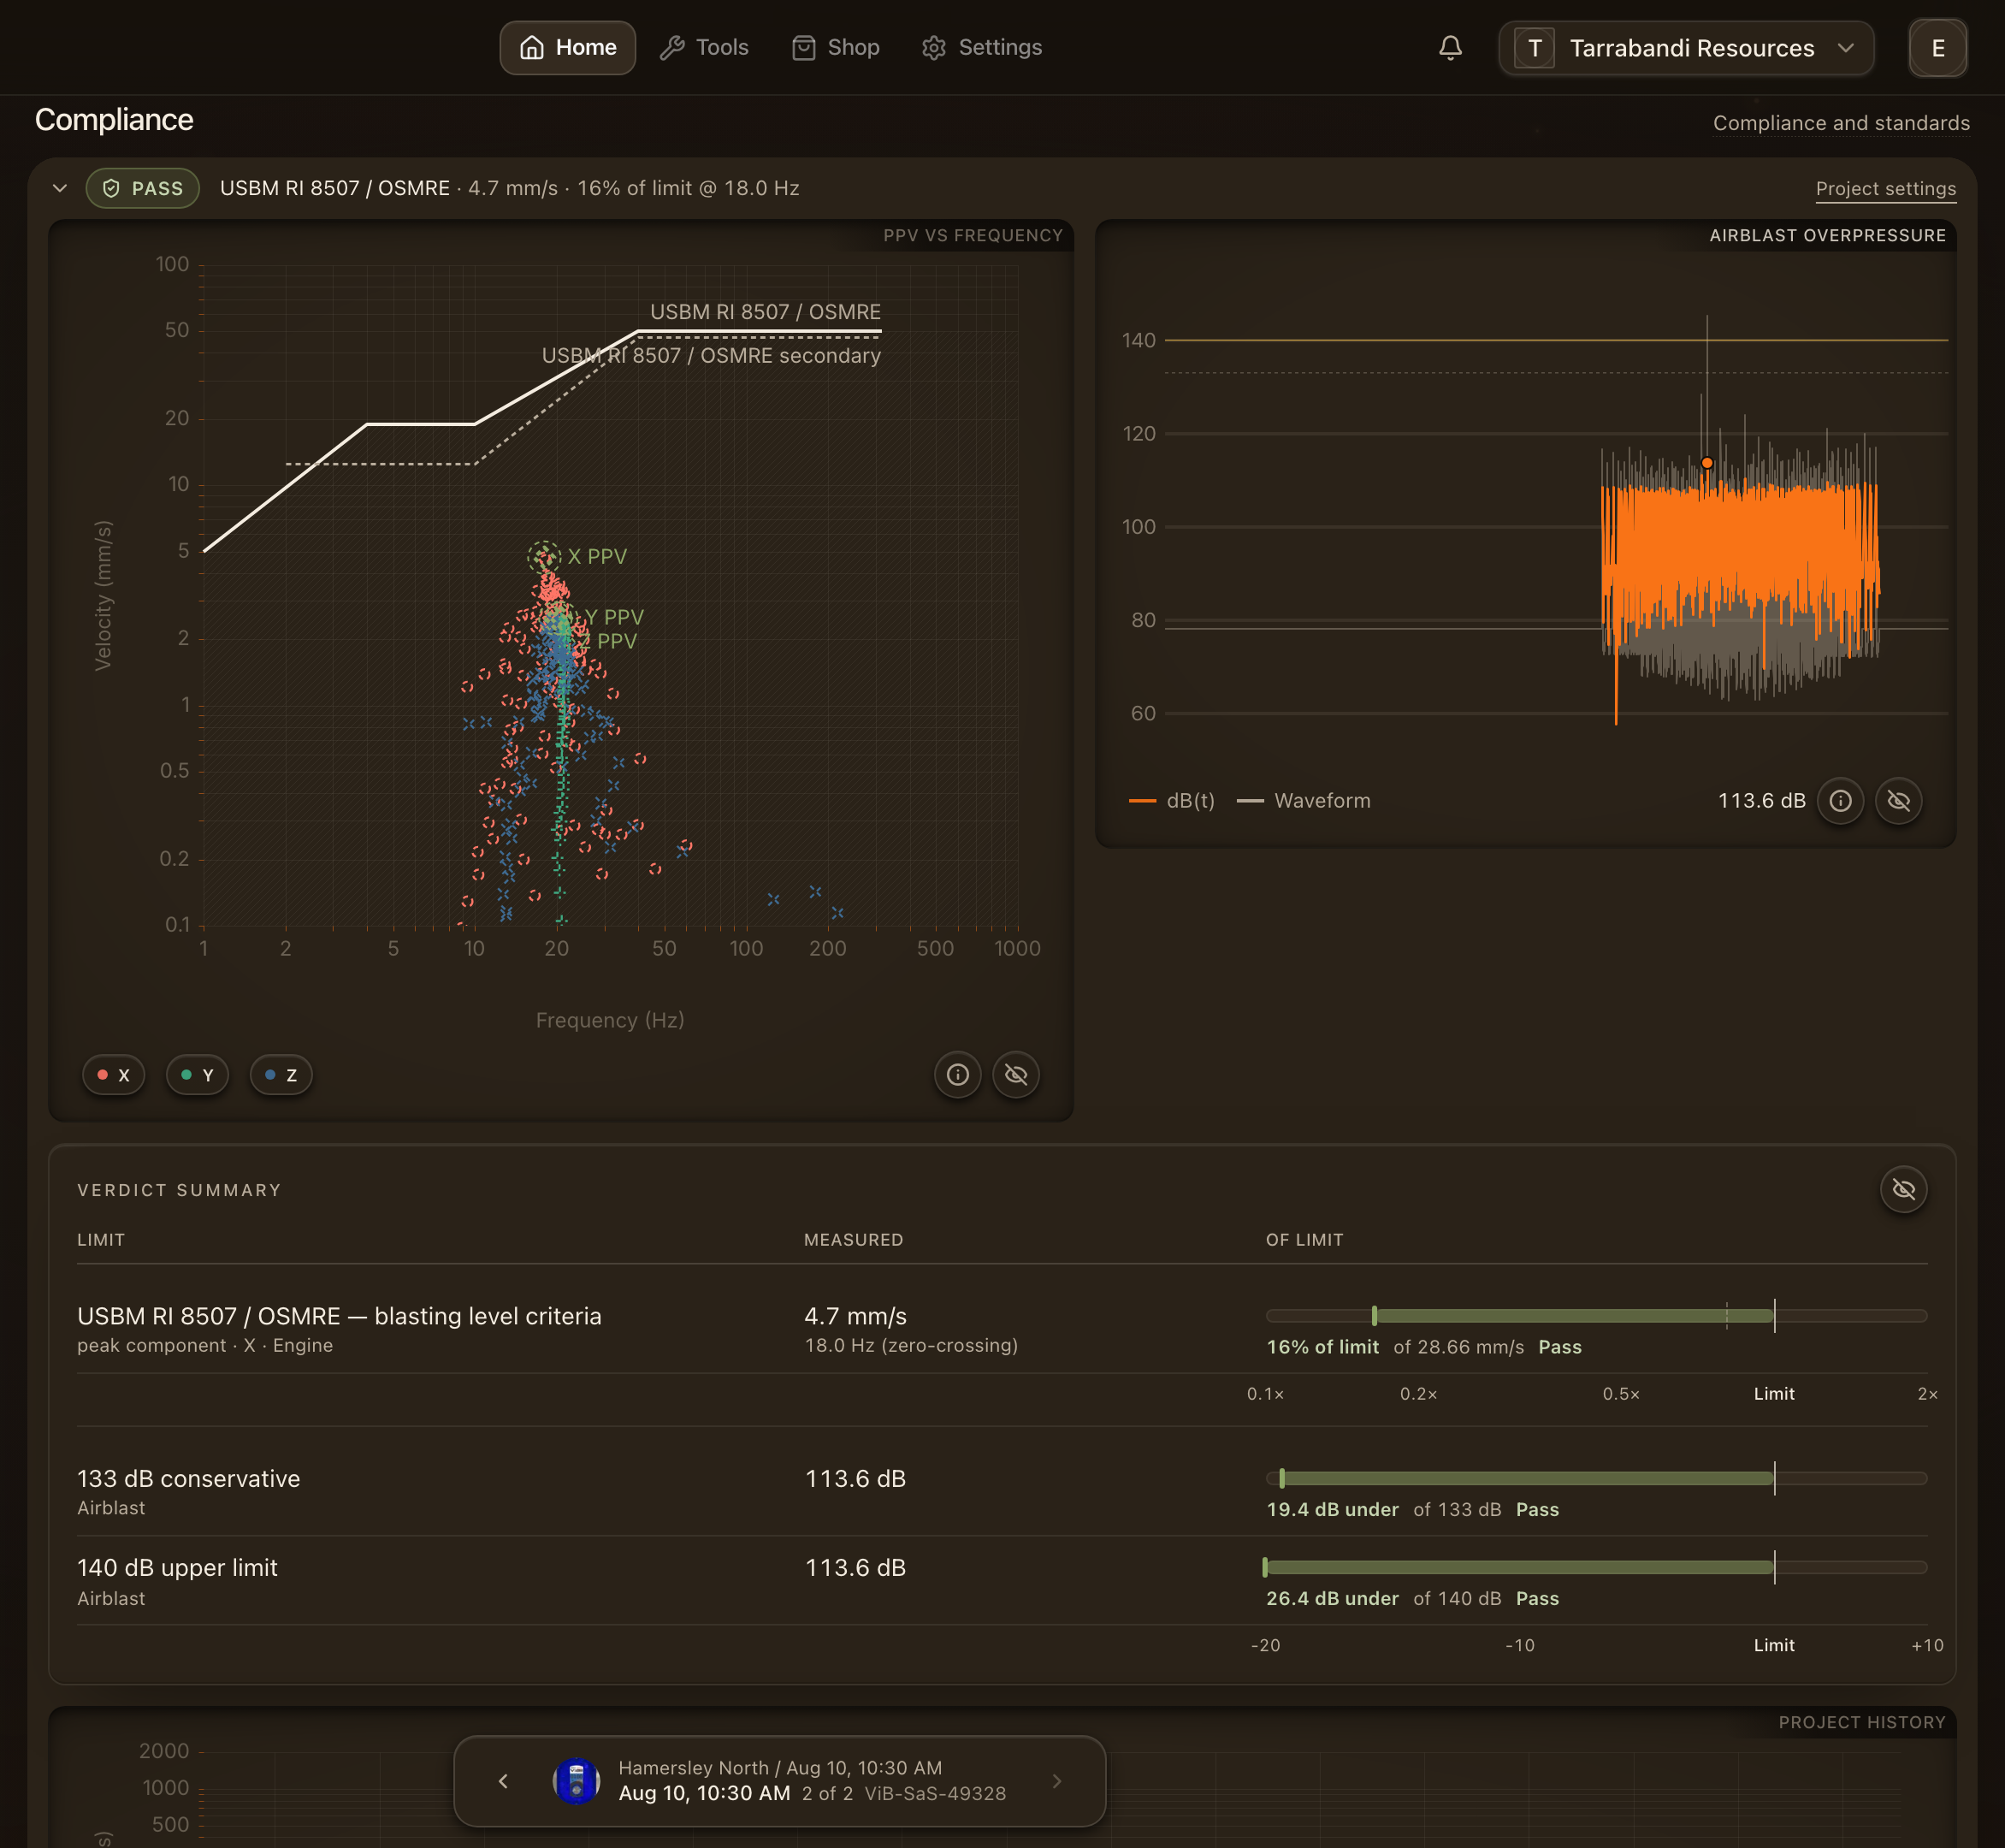
The Compliance panel scores the event against every limit your project has chosen and shows you the working. It appears under the detail chart on the page and as its own column in the full-screen workspace.
Standards and limit curves
Choose the applicable standard in project settings; every event in the project is then scored against it. The published curves are the mining standards:
- AS 2187.2 Appendix J: human comfort at 95 % of blasts and the maximum for any blast, with structural assessment adopting the BS 7385-2 lines.
- USBM RI 8507 / OSMRE: the blasting level criteria as the limit, with the secondary criteria drawn dashed as a reference that is never scored.
- A site limit you set yourself, when a permit or a client sets a flat number.
A curve is drawn dashed when it is a reference and solid when it defines the verdict. The panel's header names what the event was Assessed against and whether the limits came from the project setting or were set on this event.
The curve data is transcribed from the standards and is being verified against the purchased documents before release. Treat verdicts as an engineering aid, not a certificate.
How the verdict is reached
The engine scores the peak of each axis at the event's dominant frequency, read first from the zero crossings around the peak and, when that is not possible, from the spectrum. The verdict is Pass, Warn or Fail against each limit, or Not scored when the recording cannot be evaluated against it. Some standards allow a share of blasts to exceed the comfort level; that share is judged over the project's history, and the table says so.
Records made in peak-vector-sum mode have no per-axis velocity trace to plot against frequency, so only flat limits are scored for them.
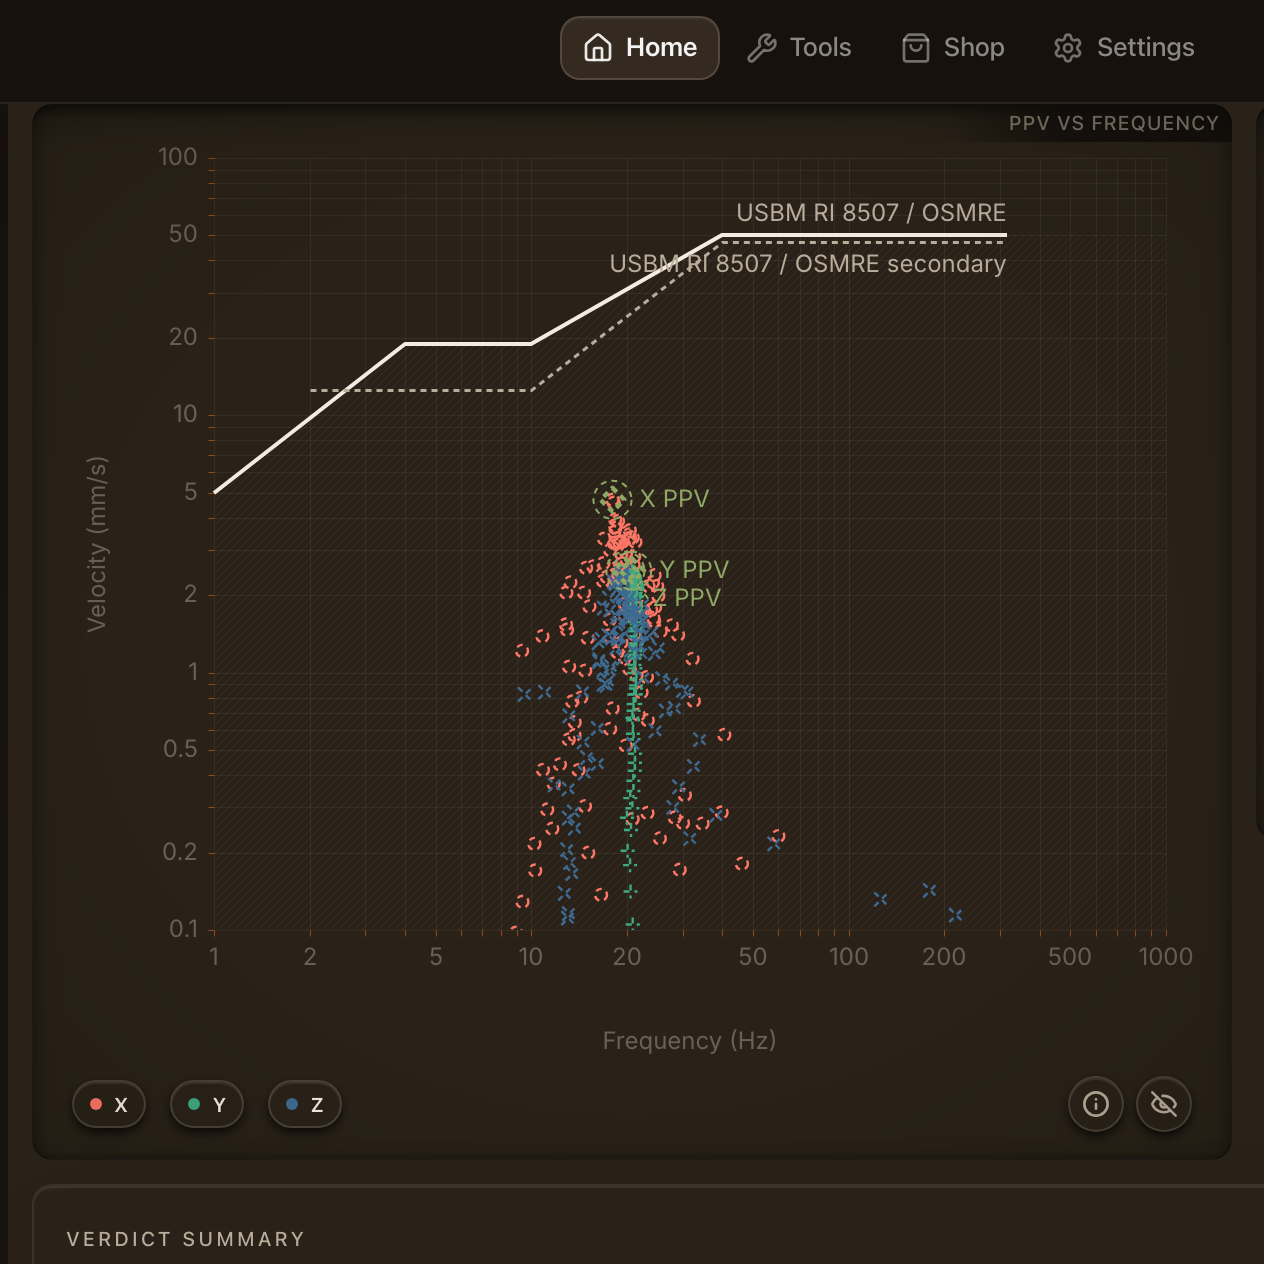
PPV against frequency
Every half-cycle of the velocity trace is a dot at its own frequency, with the scored peak per axis marked. The applicable curves cross the plot. A dot above a solid curve is an exceedance and the caption counts them. The verdict is still the peak at the dominant frequency, not the highest dot.
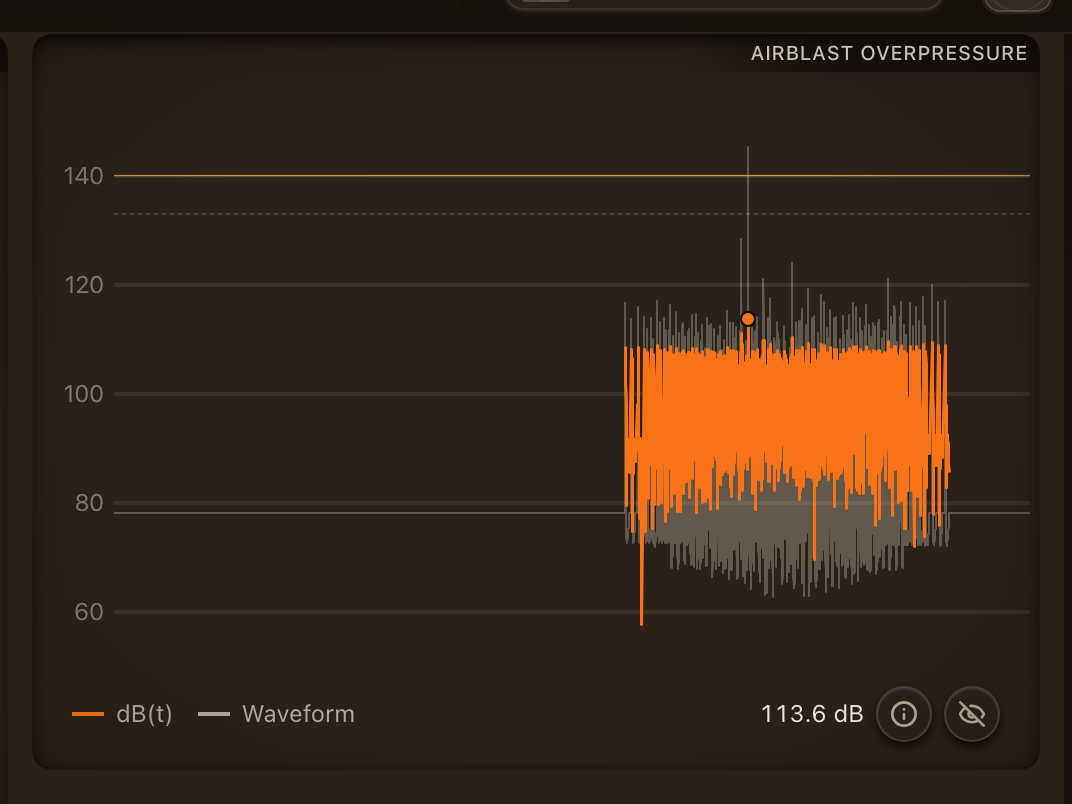
Airblast overpressure
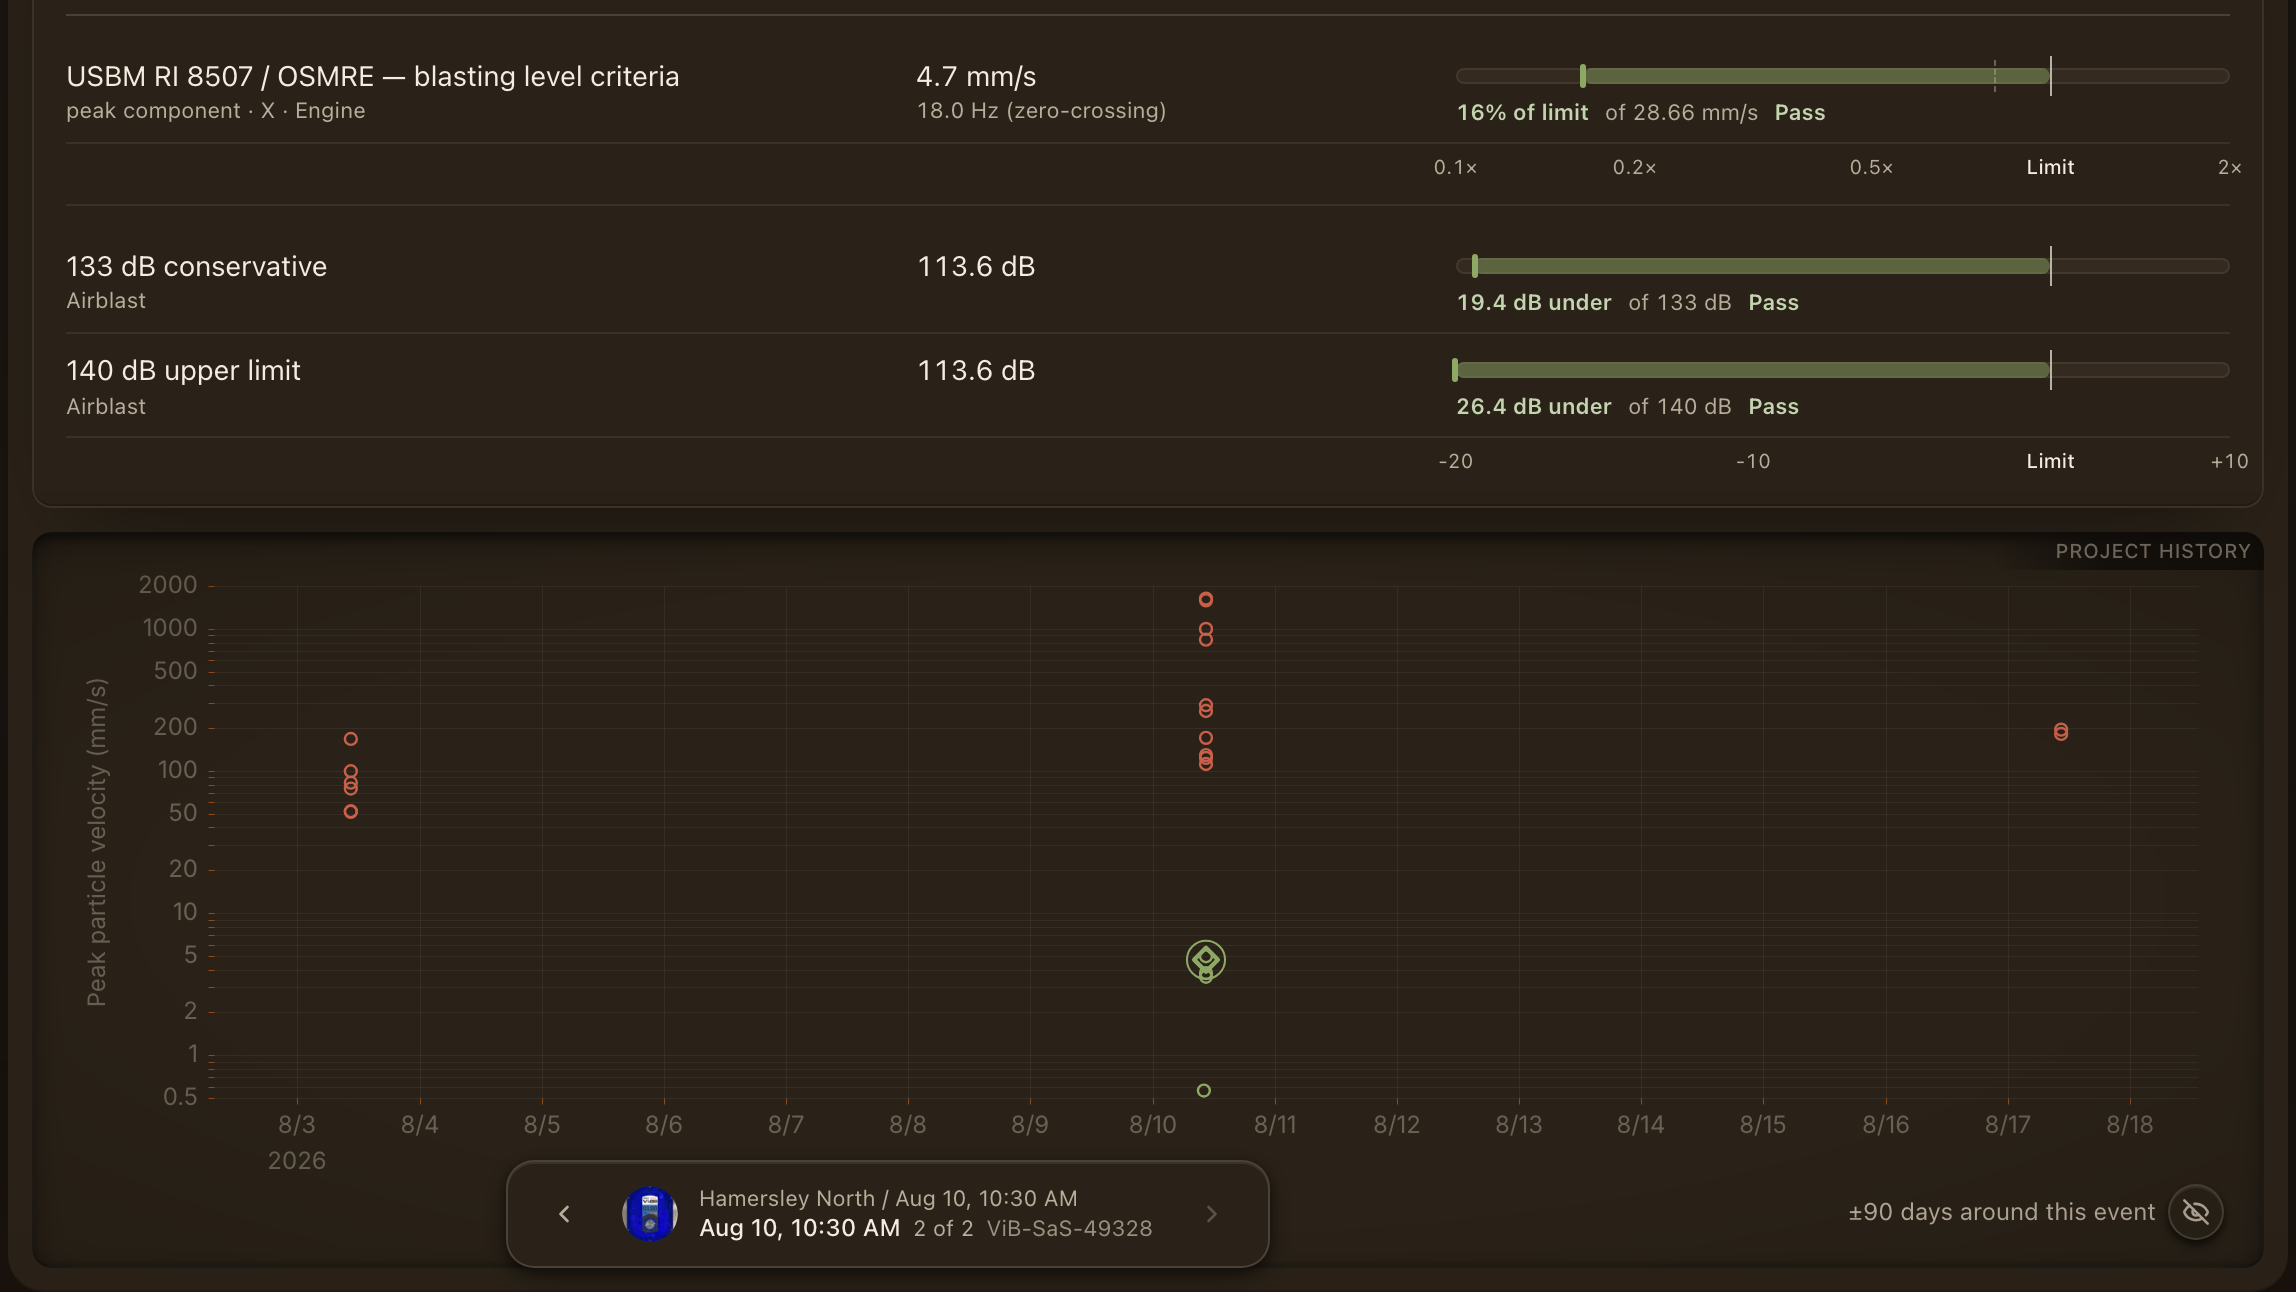
When the session recorded a microphone, the event's peak airblast overpressure is drawn against the family's dB lines: 133 dB (reference) and 140 dB (limit) for USBM, 115 dB and 120 dB for AS 2187.2. The card says whether the peak was device-reported or computed from the microphone samples. Without a microphone the row reads as not scored.
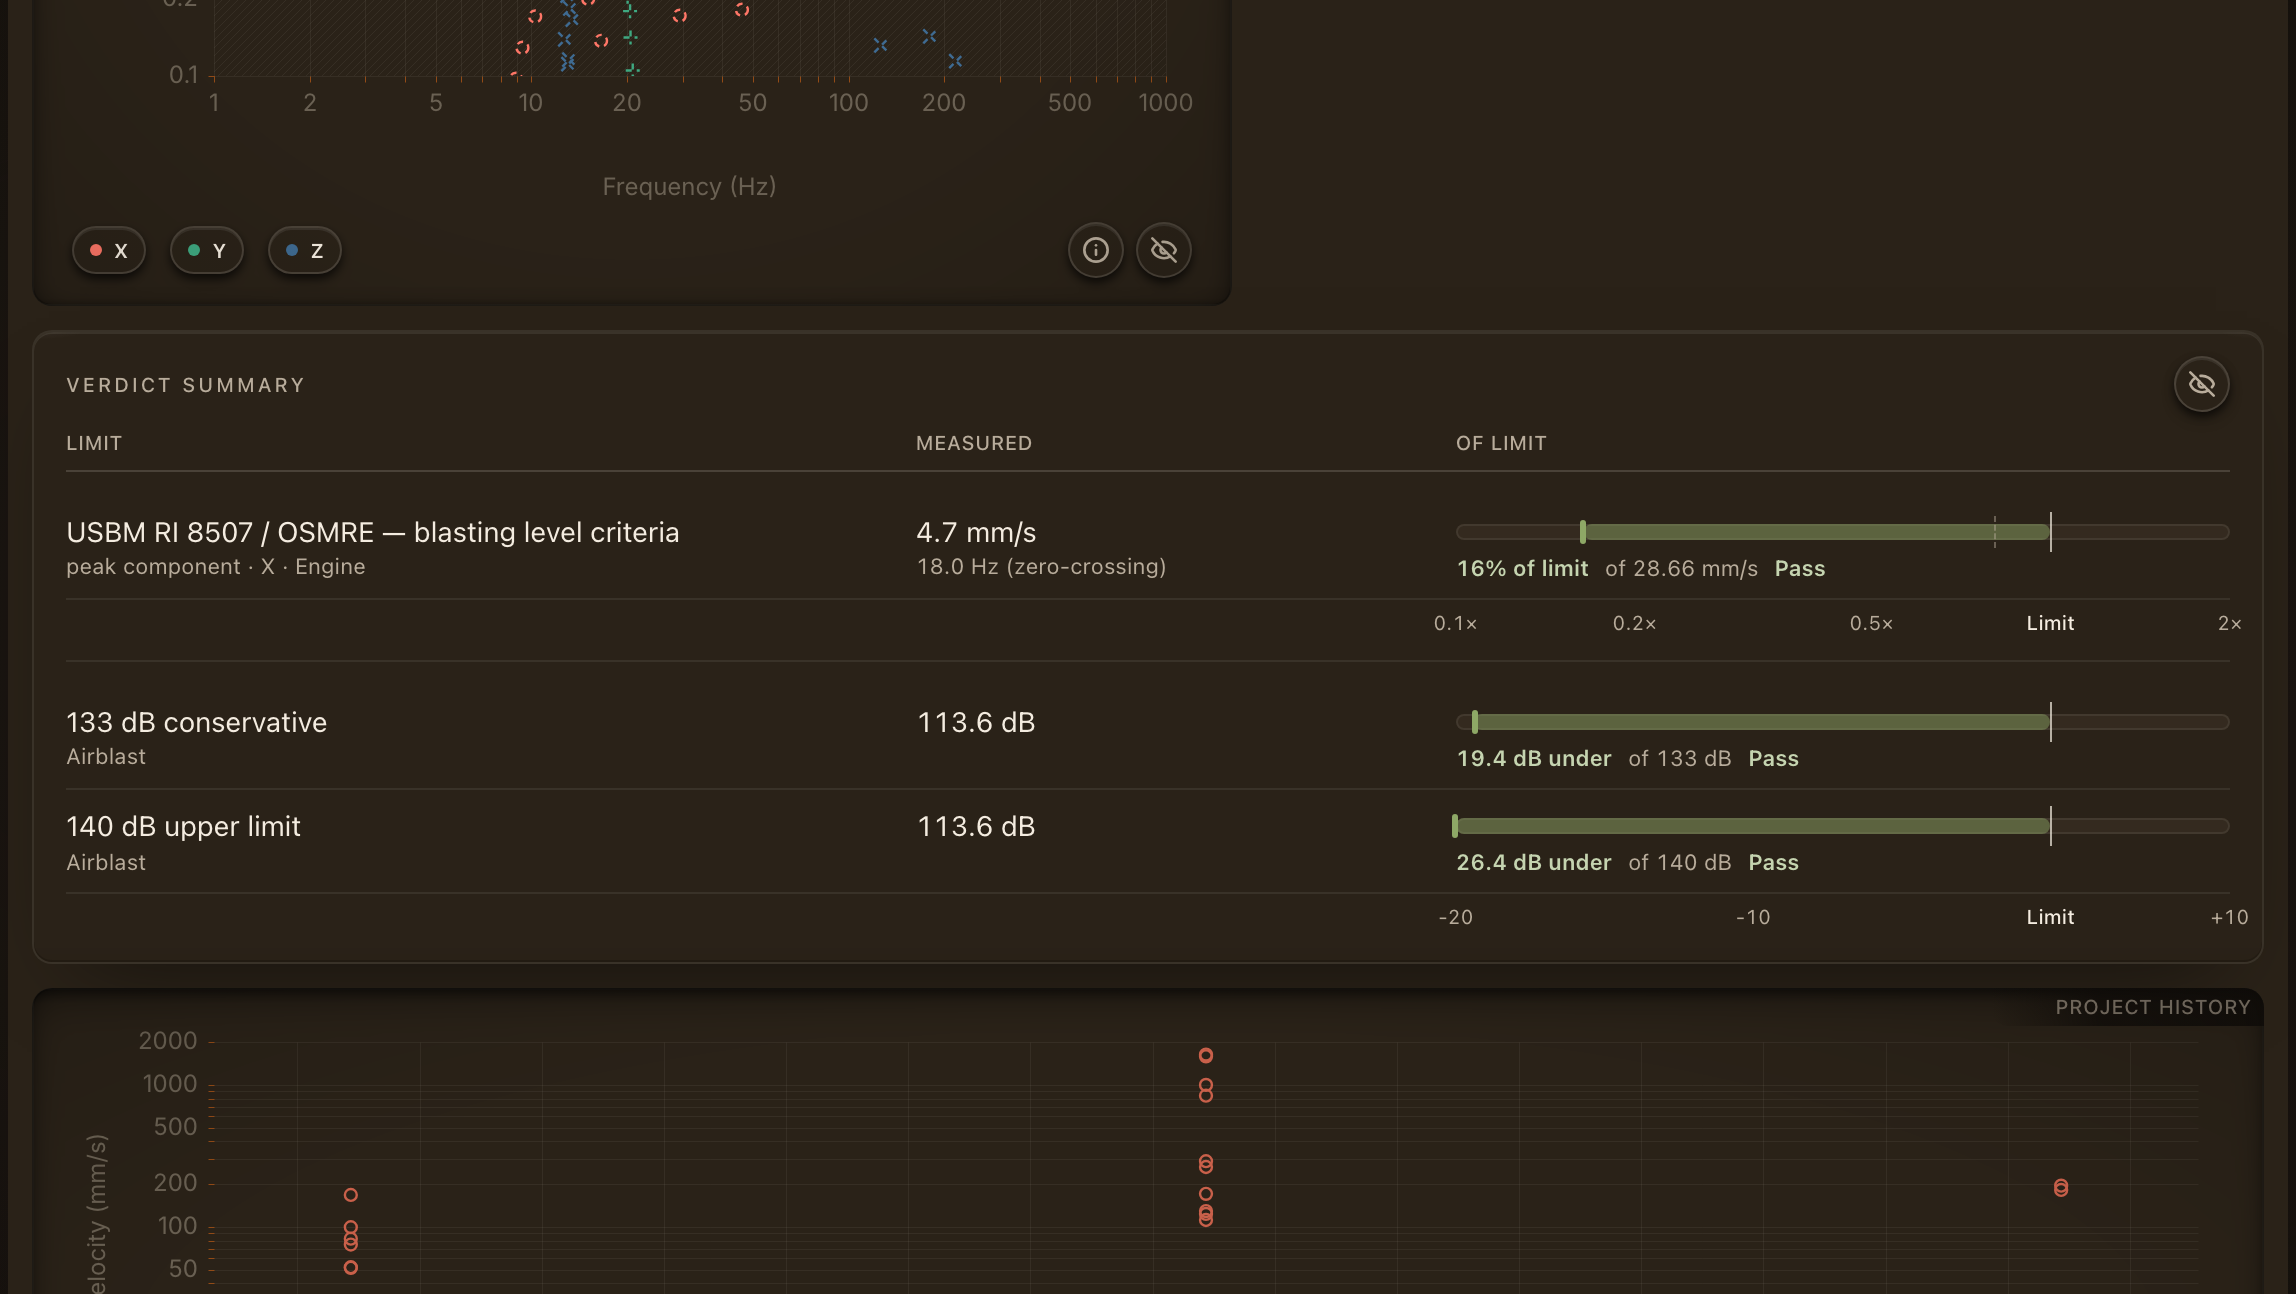
Limit margin
One bar per axis per limit, as a percentage of the limit with the warning and limit marks drawn on it. A bar past the limit reads as a multiple over; an airblast bar reads in dB under or over.
Verdict summary
One row per applicable limit: the measured value and whether it is a peak component or the vector sum, the scoring frequency, the limit value, the margin and the verdict. The Source column tells you whether the engine scored it or the panel estimated it from the decoded peaks because the artifact carried no engine verdicts.
Project history
Peak particle velocity of every event in the project over time, with this event highlighted against the flat limits. The window is a number of days either side of this event. It is where a pattern shows: a site creeping towards its limit, or one outlier.
An event outside compliance
Not every unit is placed for a limit. One set beside the pattern to calibrate the site law records motion hundreds of times what any structure would be allowed, by design, and scoring it against a far-field line would fill the project with exceedances that mean nothing.
For that event, open its report content and set Compliance standard to None (no compliance limit on this event). The panel then reads Measured, not judged: the readings are kept, no verdict is given, and the event report and the blast report say the same. The project's standards are untouched, and every other event is still scored against them.

Hiding a chart
Each card's menu can hide this chart for the project. It disappears from every event page in the project and is never printed in its reports; turn it back on in project settings.