Reading the traces
Switch between acceleration, velocity, displacement, frequency and particle motion, overlay or stack the axes, choose how the scales behave, and isolate a single channel.
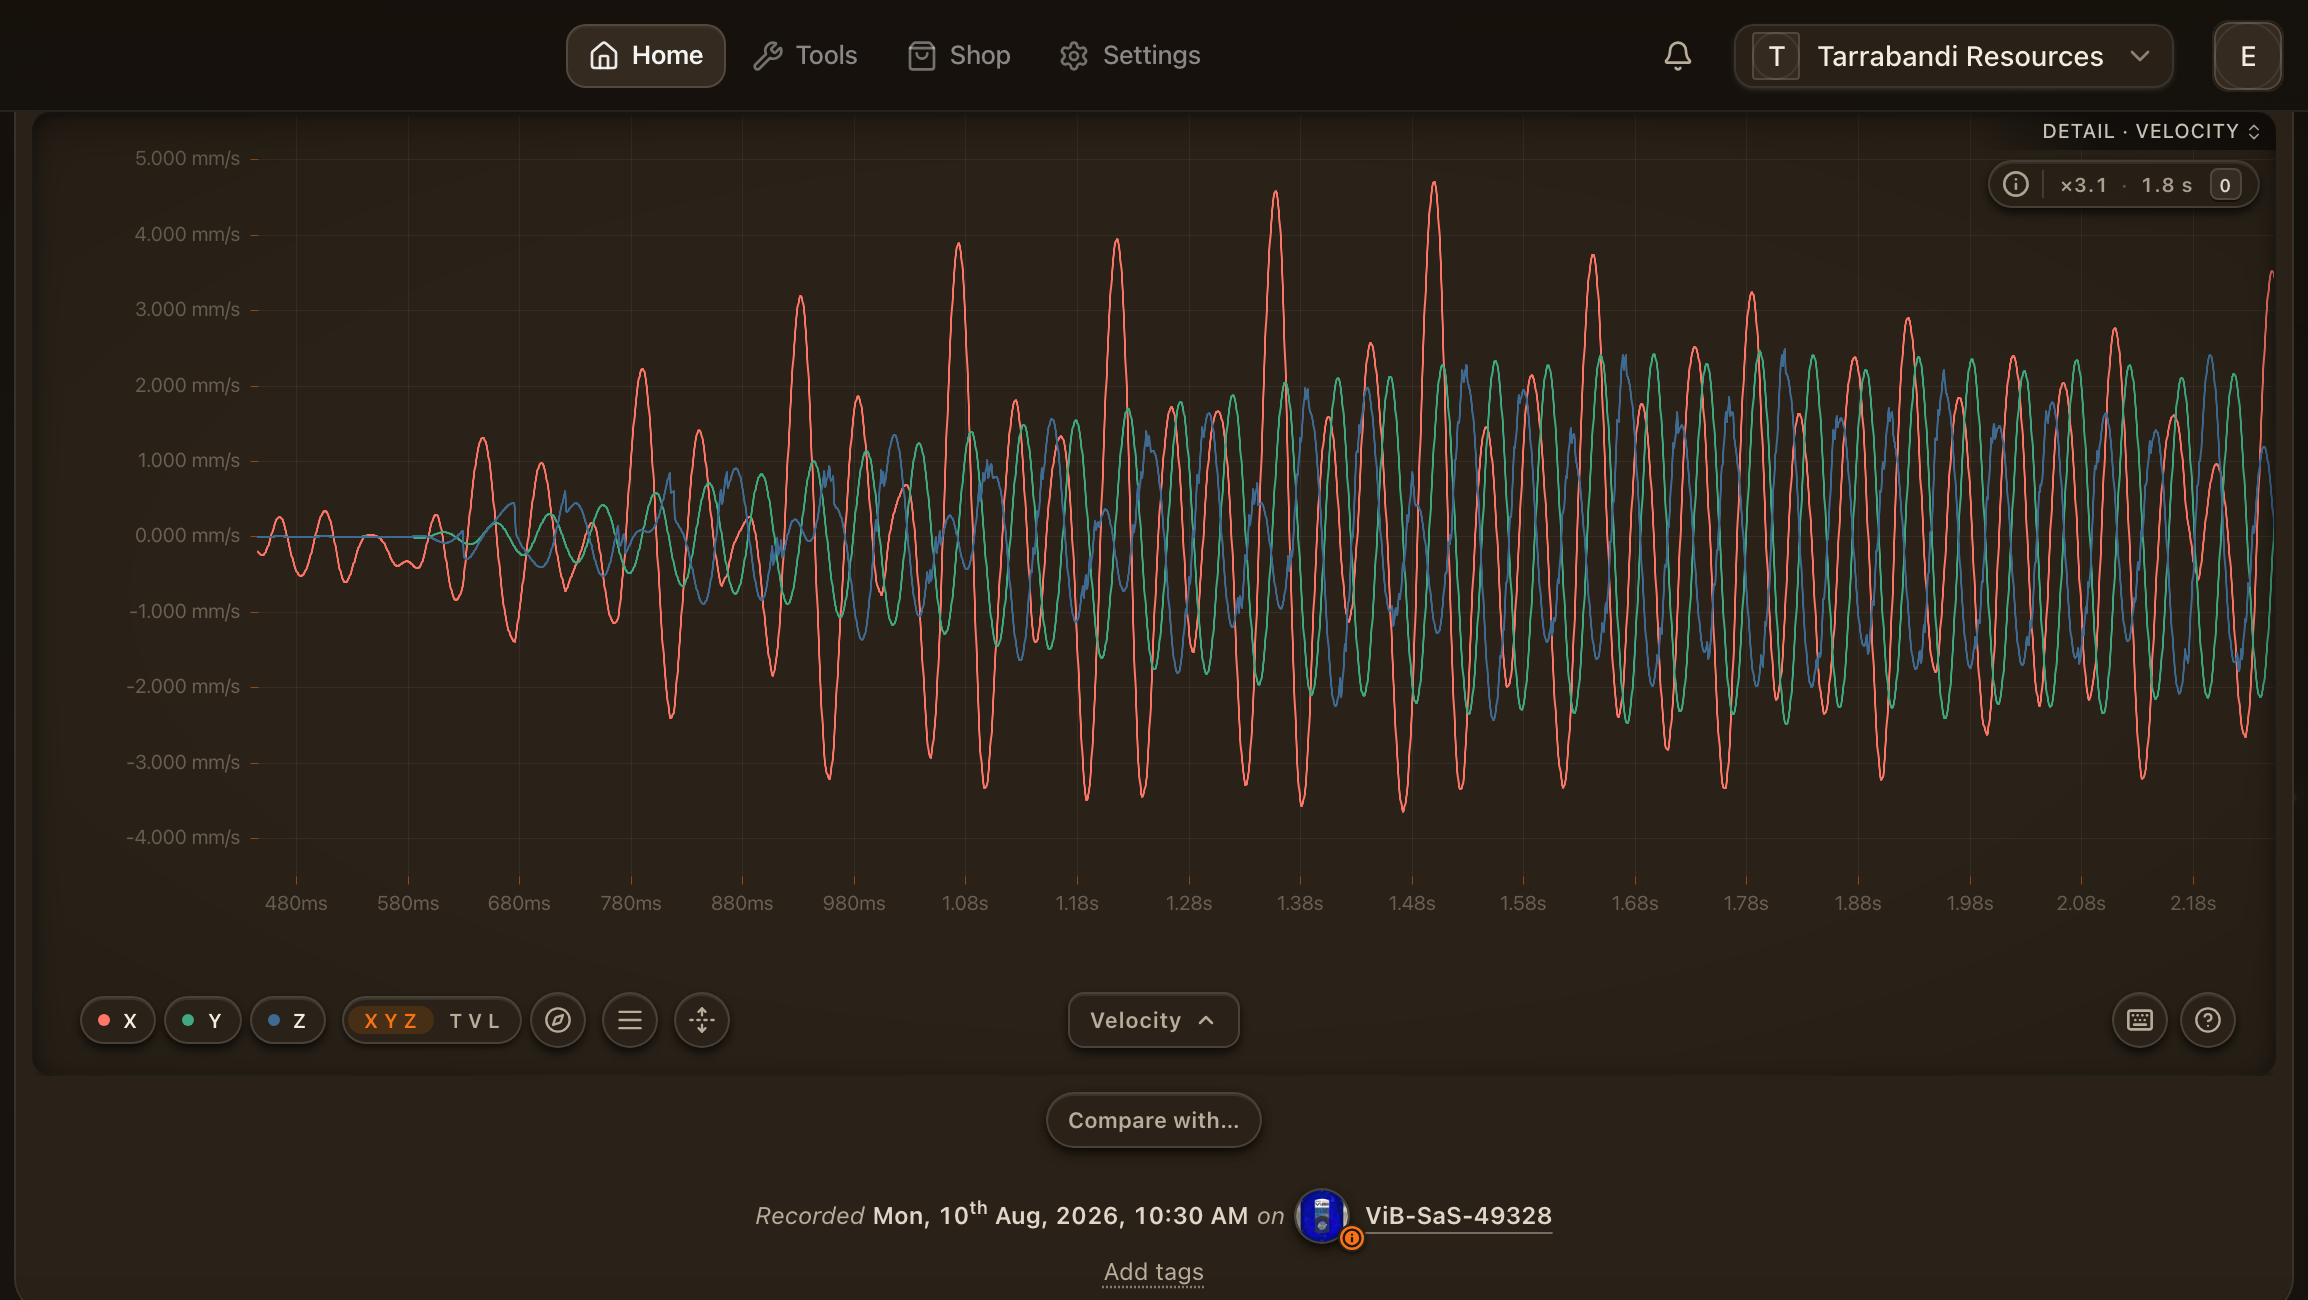
The detail chart draws the same motion five ways. Pick the view that answers your question, then decide how the three axes share the plot.
The five views
| View | Key | What it shows |
|---|---|---|
| Acceleration | C | What the sensor measured, in g. |
| Velocity | V | The integrated motion in mm/s. Peak particle velocity (PPV) and most limits live here. |
| Displacement | S | The second integration, in mm. |
| Frequency | Q | The spectrum of the trace. Press 1, 2 or 3 to choose the spectrum of velocity, acceleration or displacement. |
| Particle motion | P | The three channels as one path: each tile plots two axes against each other over the window in view. See Particle motion. |
Press , and . to step backwards and forwards through the views, or click the chart title to cycle them. Velocity and displacement are derived from acceleration by the analysis engine, not in the browser, so the figures you read match the ones in the report.
Overlaid or stacked
By default the three axes draw on one plot so their timing lines up. Press X to stack them, one pane per axis. Stacking is the right choice when one axis dwarfs the others: the analyser warns you with a Scale badge when a channel's peak is many times the next, because on a shared axis the quieter channels draw flat.
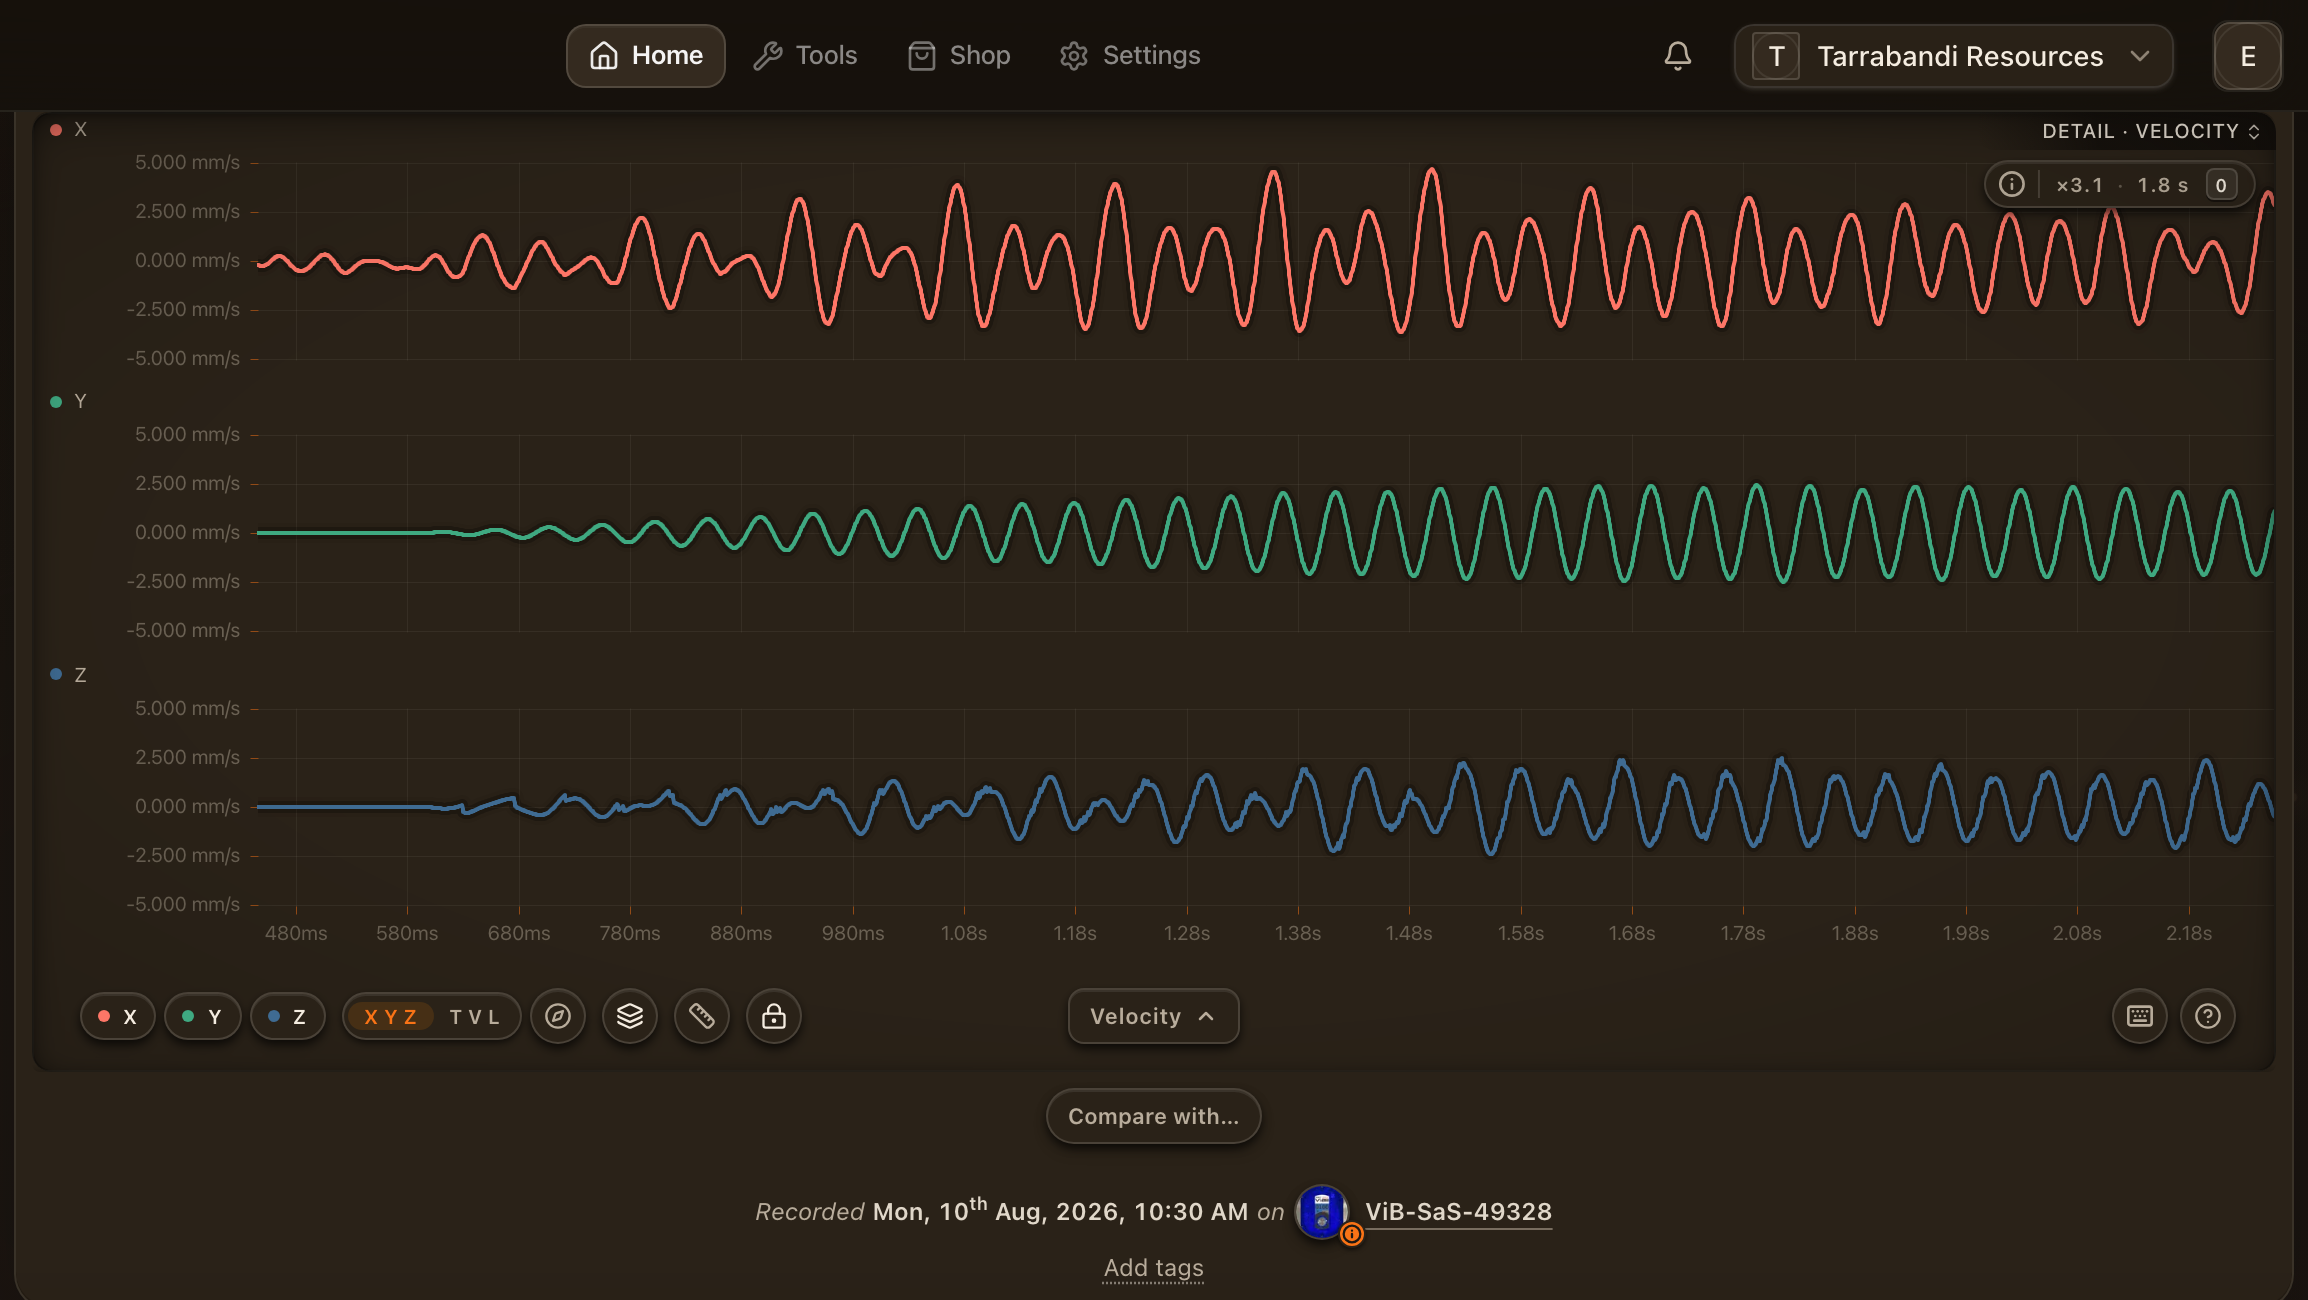
With stacked panes, press Shift+Y to switch between one shared scale across the panes and each pane on its own peak. Heights only compare when the scale is shared, so read the panes on one scale before you judge which axis dominates.
Holding or fitting the scale
Press Y to choose whether the vertical scale is held to the whole record or fitted to the zoom window. Hold it when you want to see how small a section is against the event's peak; fit it when you are reading detail inside a quiet section.
Channels and axes
The pills on the toolbar are the recorder's three channels: X, Y and Z, the axes of the accelerometer exactly as it wrote them. A recorder can sit at any angle and nobody aims it at the shot, so the analyser never calls a channel transverse, vertical or longitudinal on the strength of which axis it is. The peak vector sum is the figure that does not depend on how the unit was lying. Press Alt+1, Alt+2 or Alt+3 to show or hide the first, second or third channel. A hidden channel drops out of the chart and out of every measurement, so what you see is what you measure. Press L to show or hide the legend.
Recordings made in peak vector sum mode carry a single combined trace instead of three axes. The pills do not appear for those, and the frequency view and the per-axis compliance curves are not available. Flat limits are still scored.
Over-range and other warnings
An Over range badge means a channel reached the recorder's full-scale range and the trace is clipped at its peaks. Every figure taken from a clipped trace, including the peak, its frequency, the integrated velocity and the verdict, is a floor rather than a measurement. Treat the event as at least that large.
Airblast
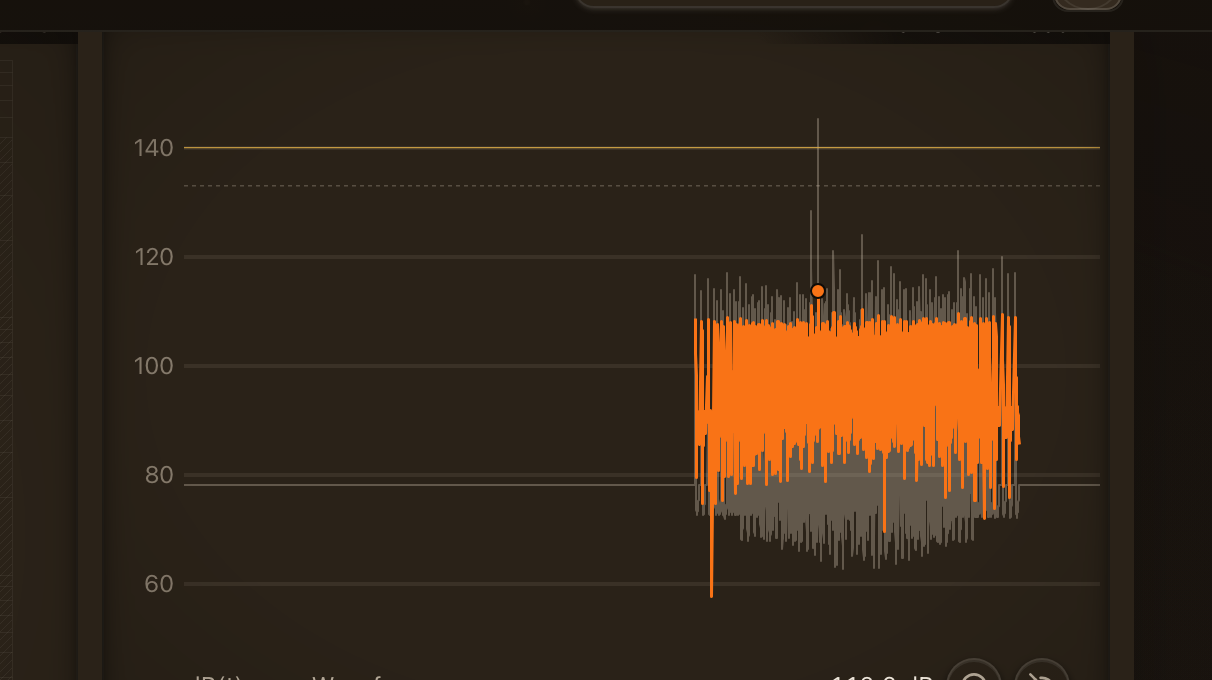
Airblast is not one of the traces. When the session recorded a microphone, the event's overpressure is read in the compliance panel's Airblast card, below the chart: it draws the microphone signal as a waveform or as a dB envelope over time, marks the peak, and scores it against the standard's decibel lines. The peak is matched to the device-reported reading when one exists; otherwise the scale is provisional and the card says so. See Compliance and standards.