
Particle motion
Press P to see the three channels as one path: the ground particle's own scribble, with the peak vector sum as its farthest excursion and the first motion as a placement check.
A tri-axial monitor records one point on the ground moving in three directions at once. The traces show those three directions one under the other; the Particle motion view plots them against each other, so the record becomes the path that point actually traced. Press P or pick Particle motion from the chart-type menu.
Reading the tiles
Four tiles show one path. The first is 3D. The other three are its projections onto the recorder's own axis planes: Y – X, Y – Z and X – Z. They are the unit's planes, not the ground's: which one is closest to a plan view depends on how the unit was lying. Every tile shares one scale, so a long thin loop in one and a short fat one in another are the same motion seen from two sides.
Where there is no room for four — the full-screen workspace's pane, a phone — the tiles show two at a time, and a small switch above them chooses 3D · Plan or Sections. It opens on the 3D view and the plan.
Turning the 3D view
Drag the 3D tile to turn the path; the three channel axes turn with it, so you always know which way is which. A rotating scribble on a flat screen is ambiguous on its own, which is why the projections stand beside it — but it is the quickest way to see the motion. Turn it until you look down from above and the first push lies along the line to the blast. Tip it onto its side and you see how much of the motion was vertical.
Tracing the motion through time
This is the part that makes the view. Move the pointer along the Overview strip — or over the traces, in the full-screen workspace — and the particle follows it on every tile, with a short fading trail behind it. Slide slowly through the arrival and you watch the ground move as it did, from the first push onward: a path that was a tangle becomes a sequence.
The PVS ring marks the sample of the peak vector sum: on a hodogram it is simply the farthest the particle got from rest, and whether it got there along one channel or on a resultant is plain to see.
The path is cut to whatever the traces show. Drag a measurement on the detail chart and the tiles redraw with only that span; zoom, and they follow the zoom; clear both and they show the whole record.
Acceleration, velocity or displacement
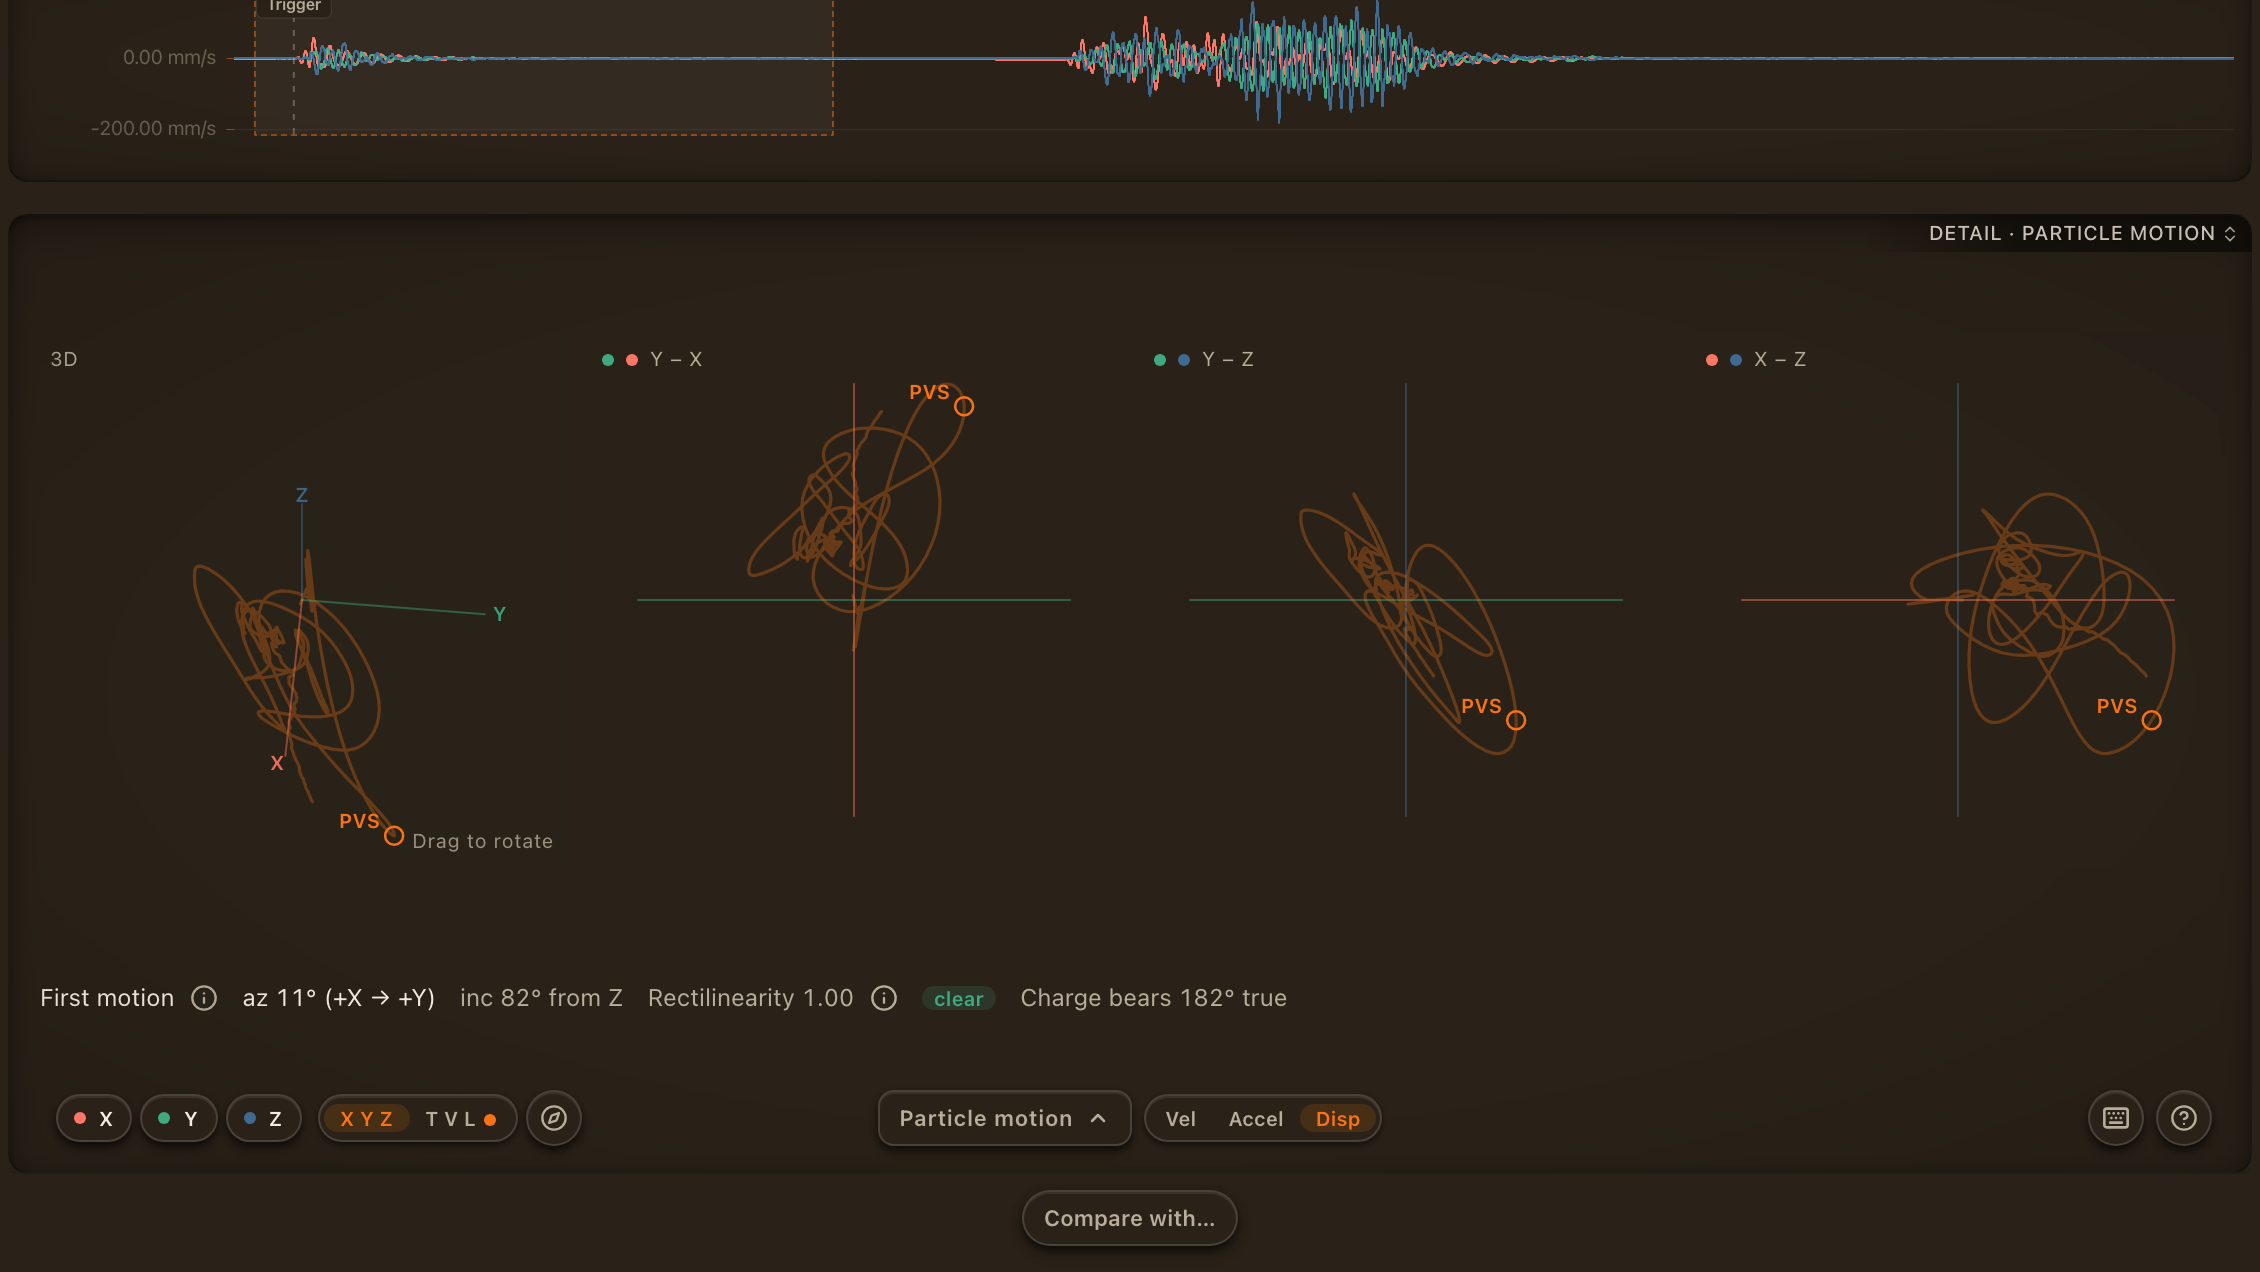
The Vel / Accel / Disp control picks the quantity the path is drawn in, independently of the spectrum's. Velocity is the default because it is what every limit is written against. Acceleration sharpens the first arrival. Displacement is the literal path, how far the ground actually travelled, but is the least well conditioned after two integrations.
First motion

The line under the tiles reads the direction the ground first moved. It is measured over the first quarter-cycle after onset, against the recorder's own axes: the azimuth is degrees from +X towards +Y, and the incidence is the angle from Z.
Those angles describe the unit and the motion together. A recorder can sit at any angle and nobody aims it at the shot, so on their own they are not a bearing to the blast, and the analyser does not print a source direction from them. An explosive source is compressional: the first arrival moves the ground away from the shot and up. Turning that into a direction needs to know which way is up for this unit, which comes from gravity rather than from assuming Z.
Rectilinearity
Rectilinearity says how much of that first motion lay along one line: 1 is a straight line, the mark of a clean compressional arrival; 0.5 is a circle in a plane. It is the quality of the direction reading, not a property of the blast. Readings under 0.7, or with too little signal above the pre-trigger noise, are labelled weak and the direction should not be relied on; when nothing usable can be picked the line says First motion unclear. A clipped record shows no reading at all: a path drawn from a truncated trace is a floor, not a measurement.
Note that a quarter-cycle of any motion is nearly a line, an ellipse's included, so the readout names the first motion and never the wave type. Select a longer span on the traces and the selection card reports the polarisation of the whole window, which is where an ellipse shows.
Full screen
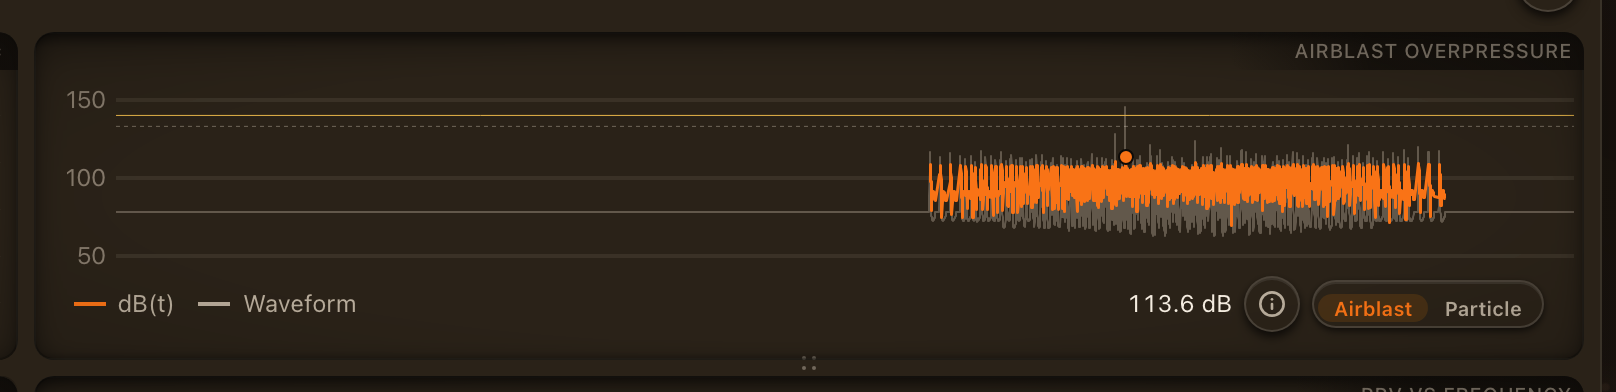
In the full-screen workspace the tiles also sit in the top-right pane, opposite the traces, where they share the cursor with the detail chart beside them. On a unit with a microphone that pane opens on Airblast; on one without it opens on Particle, and a control at the foot of the pane switches between the two. The pane shows the tiles two at a time, opening on the 3D view and the plan; the switch above them brings up the two sections.