
Measuring and zooming
Measure a span of the trace, read what is in view, and zoom and pan with the mouse, trackpad or keyboard.
Two gestures do most of the work: a drag on the Overview chooses the window, and a drag on the detail chart measures a span inside it.
Measure a span
Drag across any detail trace. A Measured span readout appears with, for each channel, the peak in the active view's unit, the frequency read from the zero crossings either side of that peak, the RMS, and the end-to-end change. The duration of the span sits on the dimension line.
From the readout you can:
- press Enter to zoom to this span;
- click Keep this span as a zone to turn it into a zone (see Zones, holes and timing);
- press Esc or double-click the chart to clear it.
Frequency from zero crossings is what regulators read a peak against. It is reported to the precision the sample rate supports.
What is in view
Press I, or click the readout chip at the top right of the chart, to open What is in view. It reads whatever the plot is showing: each channel's peak, zero-crossing frequency and RMS over the visible window, plus the vector sum. With the whole record in view it adds the event's own figures: Peak Vector Sum, the largest √(x² + y² + z²) at any single instant, PPV and dominant frequency. Zoom in and the numbers follow. Click the chip itself to reset the zoom.
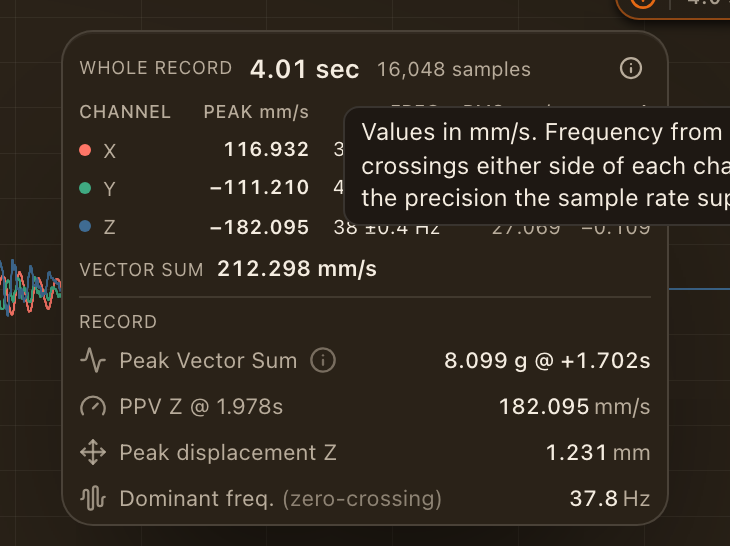
Every number has an info icon. It tells you the formula, the scope the value was read over, and why it can differ from a similar-looking figure elsewhere. The stored event PVS comes from the processing pipeline and can differ slightly from a selection recomputed in the browser.
Zoom
| Action | How |
|---|---|
| Frame a window | Drag across the Overview |
| Zoom in or out | + and -, or ⌘/Ctrl + scroll, or pinch |
| Zoom under the pointer | ↑ and ↓ while the pointer is over the plot |
| Zoom to the measured span | Enter |
| Reset the view | A or 0, or double-click the chart |
Pan
| Action | How |
|---|---|
| Drag to pan | Hold Space and drag |
| Nudge or glide | ← and → while zoomed (tap nudges, hold glides) |
| Half a window | Shift+← and Shift+→ |
| Start or end of the record | Home and End |
| Trackpad | Shift + scroll, or a two-finger swipe |
Cursor pills follow the pointer and read exact per-axis values at that sample.