
Comparing ranges
Read the same stretch of every hole across the whole blast, on every recorder at once: a sleeve on each hole coloured by what its range read, and one table for the blast.
A column range is the same stretch of every hole, measured up from the toe. A VoD recording holds the few holes one cable ran through. The Visualiser holds the whole blast, so here a range is read on every hole any recorder read. Press Shift+R and each of those holes gets a sleeve on its charge column, coloured by the VoD its range read.
Show ranges
Press Shift+R to step through the sets: Toe, Toe + middle, Thirds, the sets your project has saved, then Off. A caption at the bottom right of the scene names the set as it changes. Or open the settings (the gear at the right of the title bar) and choose one under Column ranges.
The sets are the ones the VoD Analyser uses; see Comparing ranges there for what each covers.
Read the sleeves
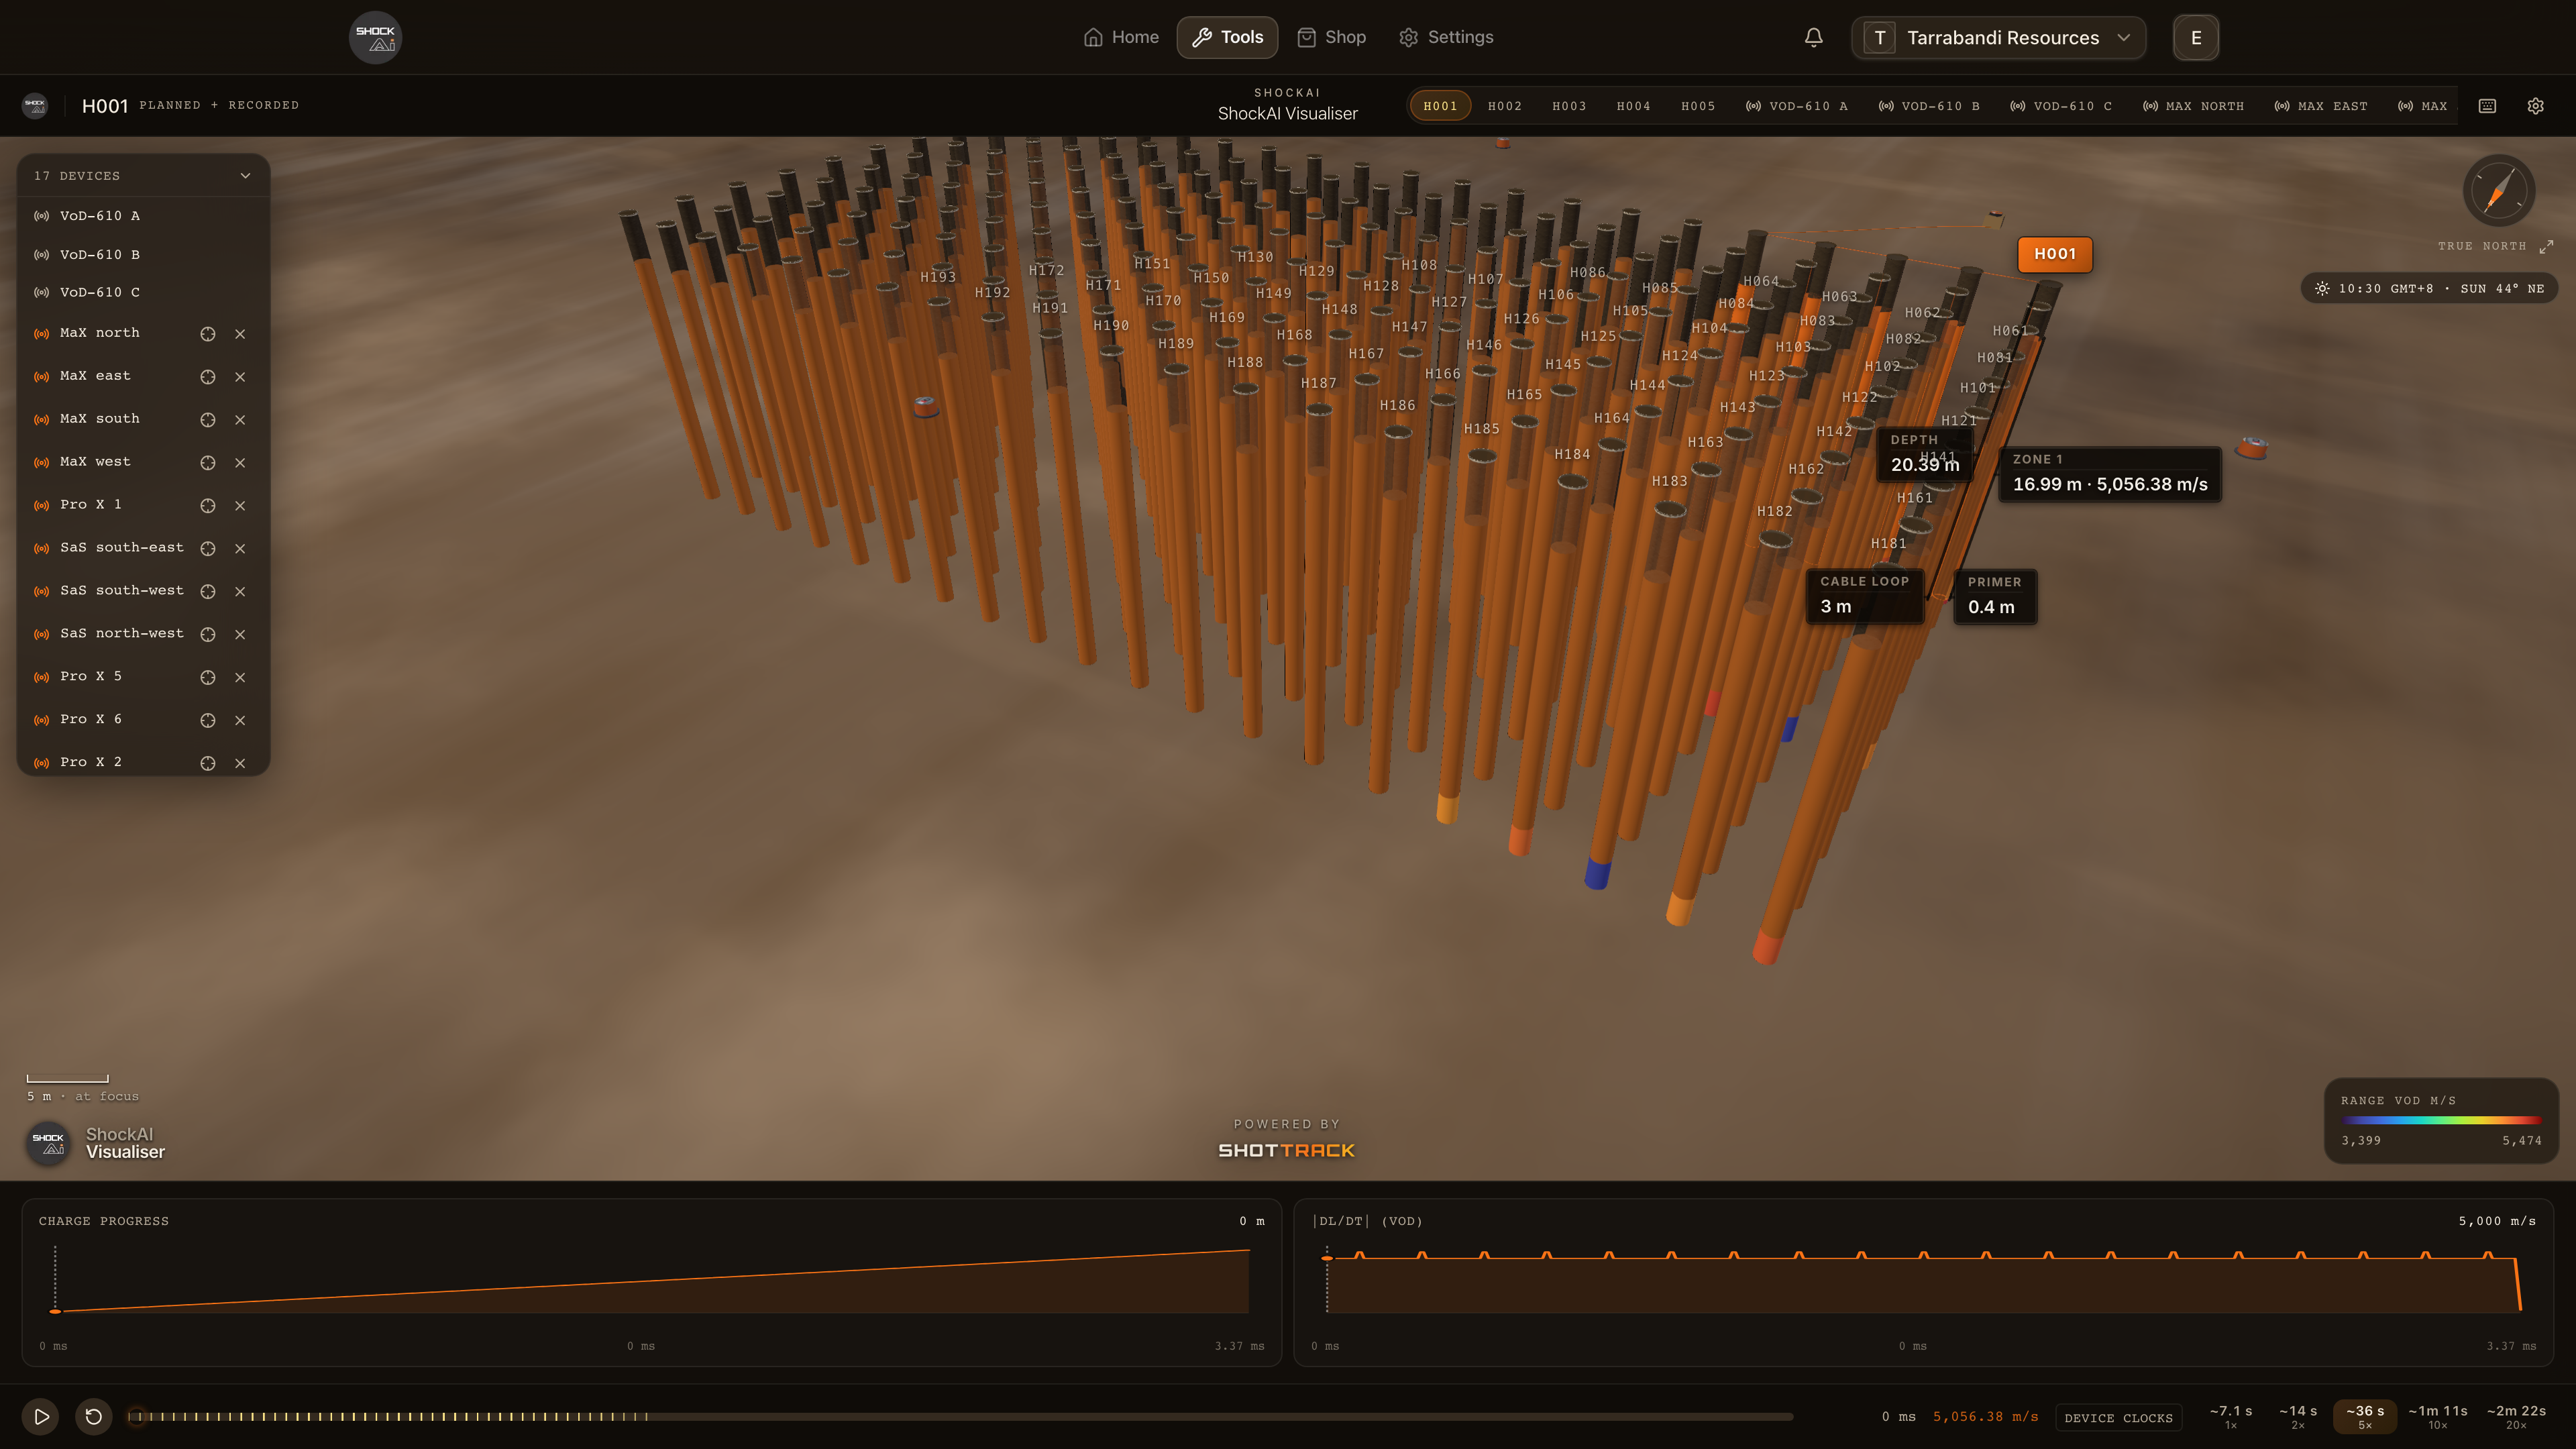
- Colour is the VoD the range read, on the scene's scale. While ranges show, the legend reads Range VoD, and the sleeves and the recorded columns share one scale.
- Neutral means a range was asked of the hole and could not be read: the hole had no zones there, or its recorder's trace is not loaded. Holes no recorder read get no sleeve.
- Position is the share of the column the range covered, from the toe of the planned charge (or of the recorded column, for the recorder in view). The scene is drawn from the plan, not from the cable, so a sleeve shows roughly where the range sits. The table has the figures.
When two recorders read the same hole, the reading of the recorder in view wins.
The table for the blast
Click Compare table… under Column ranges in the settings. The Column ranges panel lists every hole every recorder read, grouped by recorder, with a column per range. Each cell gives the range's VoD, a confidence dot and how far it sits from that range's mean across the blast, and each range gets its Mean, CV, Min – max and Holes.
- Click a row to fly to that hole. Its inspector, which Enter shows and hides, lists what each range read, and on which recorder, under Column ranges.
- Click the set's name at the top of the panel for the same list as the analyser's: the presets, the sets your project has saved, and Custom…, which sets your own ranges. Save to project… keeps them for everyone on the project, and the pencil and bin beside a saved set rename and delete it, if you can manage the project's blasts.
- Export CSV writes one row per hole and range for the whole blast, with a column naming the recorder.
From the analyser
In the VoD Analyser's Column ranges table, Compare across the blast opens this scene with the same ranges showing. The link carries the set, so it can be shared as it is.